State health care spending usually gets reported in terms of dollars per capita, leading to maps like this that show Alaska as the highest-spending state and Utah as the lowest:

But states differ greatly in how rich they are and how much they have to spend. I wanted to know the states where health care takes up the largest and smallest share of the economy, so I got the data:
Health Care Spending as Share of State Gross Domestic Product in 2019:
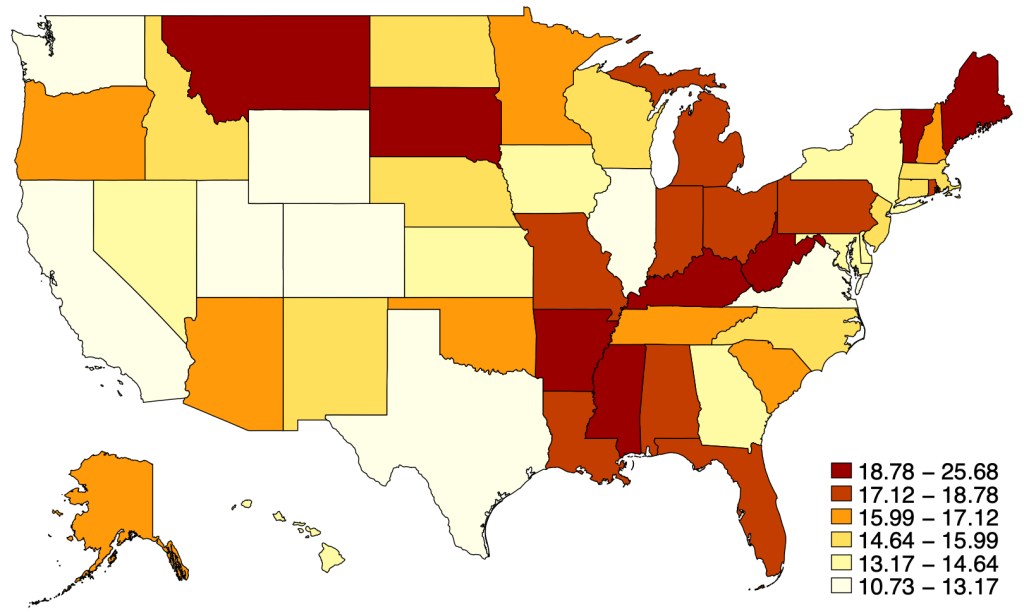
You can see that health spending as a share of GDP looks pretty different from health spending in raw dollars. We’ve gone from a high-spending North and low-spending South to more of a mix. Health spending is now highest in West Virginia, where it makes up more than a fourth of the economy; and lowest in Washington State and Washington D.C., where it makes up less than one ninth of the economy.
The biggest change when considering things this way is in Washington D.C., which has the highest spending in $ terms but the lowest as a share of GDP because it has an enormous GDP per capita. Many other states that spend a lot in $ also fall a lot in the rankings due to high GDP per capita, including Alaska, New York, and Massachusetts. The states that rise the most in this ranking are poor states like Arkansas, Alabama, and Mississippi. Mississippi rises the most, gaining 37 spots in the rankings of highest-spending states when we go from $ per capita to share of GDP.
I share the data here so you can do your own comparisons:
| State | Health Spending Per Capita | Health Spending as % ofGDP | Spending Rank | Spending Share of GDP Rank | Change in Rank | GDP Per Capita |
| AL | $8,741 | 18.43 | 41 | 10 | 31 | 47095 |
| AK | $13,226 | 16.98 | 2 | 18 | -16 | 75246 |
| AZ | $8,145 | 16.24 | 47 | 22 | 25 | 51467 |
| AR | $8,853 | 19.47 | 36 | 7 | 29 | 43921 |
| CA | $9,628 | 12.30 | 27 | 48 | -21 | 80250 |
| CO | $8,286 | 12.45 | 45 | 47 | -2 | 69071 |
| CT | $11,831 | 14.66 | 8 | 34 | -26 | 81710 |
| DE | $12,213 | 14.62 | 5 | 35 | -30 | 80121 |
| DC | $13,934 | 10.73 | 1 | 51 | -50 | 205641 |
| FL | $9,490 | 18.34 | 31 | 11 | 20 | 52144 |
| GA | $8,243 | 14.22 | 46 | 39 | 7 | 59648 |
| HI | $9,555 | 14.24 | 28 | 38 | -10 | 68443 |
| ID | $7,723 | 15.99 | 50 | 26 | 24 | 47386 |
| IL | $9,496 | 13.14 | 30 | 44 | -14 | 70735 |
| IN | $9,927 | 17.63 | 20 | 14 | 6 | 57083 |
| IA | $9,193 | 13.78 | 33 | 40 | -7 | 62446 |
| KS | $8,745 | 14.44 | 39 | 36 | 3 | 61317 |
| KY | $9,744 | 19.71 | 23 | 5 | 18 | 48798 |
| LA | $9,657 | 17.49 | 24 | 15 | 9 | 55937 |
| ME | $11,488 | 22.21 | 10 | 2 | 8 | 50989 |
| MD | $10,248 | 13.65 | 17 | 42 | -25 | 71445 |
| MA | $12,729 | 15.07 | 4 | 32 | -28 | 87608 |
| MI | $9,532 | 17.26 | 29 | 17 | 12 | 54412 |
| MN | $10,510 | 16.07 | 16 | 24 | -8 | 68877 |
| MS | $8,745 | 20.85 | 40 | 3 | 37 | 39440 |
| MO | $9,431 | 17.95 | 32 | 12 | 20 | 54158 |
| MT | $9,808 | 19.28 | 22 | 8 | 14 | 50130 |
| NE | $9,917 | 15.04 | 21 | 33 | -12 | 68026 |
| NV | $8,114 | 13.66 | 48 | 41 | 7 | 58557 |
| NH | $11,310 | 16.92 | 11 | 19 | -8 | 65233 |
| NJ | $11,264 | 15.13 | 12 | 31 | -19 | 72335 |
| NM | $8,459 | 15.55 | 43 | 28 | 15 | 50753 |
| NY | $12,932 | 14.32 | 3 | 37 | -34 | 92209 |
| NC | $8,619 | 15.43 | 42 | 29 | 13 | 57092 |
| ND | $10,653 | 15.24 | 15 | 30 | -15 | 75946 |
| OH | $10,173 | 17.33 | 18 | 16 | 2 | 60211 |
| OK | $8,923 | 16.53 | 35 | 21 | 14 | 51678 |
| OR | $9,635 | 16.06 | 26 | 25 | 1 | 60863 |
| PA | $11,175 | 17.89 | 13 | 13 | 0 | 63940 |
| RI | $10,988 | 18.78 | 14 | 9 | 5 | 59126 |
| SC | $8,345 | 16.12 | 44 | 23 | 21 | 48663 |
| SD | $11,627 | 19.61 | 9 | 6 | 3 | 62858 |
| TN | $8,827 | 16.82 | 37 | 20 | 17 | 55813 |
| TX | $8,028 | 12.98 | 49 | 45 | 4 | 64361 |
| UT | $7,193 | 12.72 | 51 | 46 | 5 | 60780 |
| VT | $12,159 | 19.81 | 6 | 4 | 2 | 55172 |
| VA | $8,826 | 13.17 | 38 | 43 | -5 | 66038 |
| WA | $8,964 | 11.10 | 34 | 50 | -16 | 81477 |
| WV | $11,951 | 25.68 | 7 | 1 | 6 | 44540 |
| WI | $9,652 | 15.95 | 25 | 27 | -2 | 60741 |
| WY | $10,111 | 11.25 | 19 | 49 | -30 | 70688 |

One thought on “Where is Health Care The Biggest Part of the Economy?”