Race & Sex & College Major

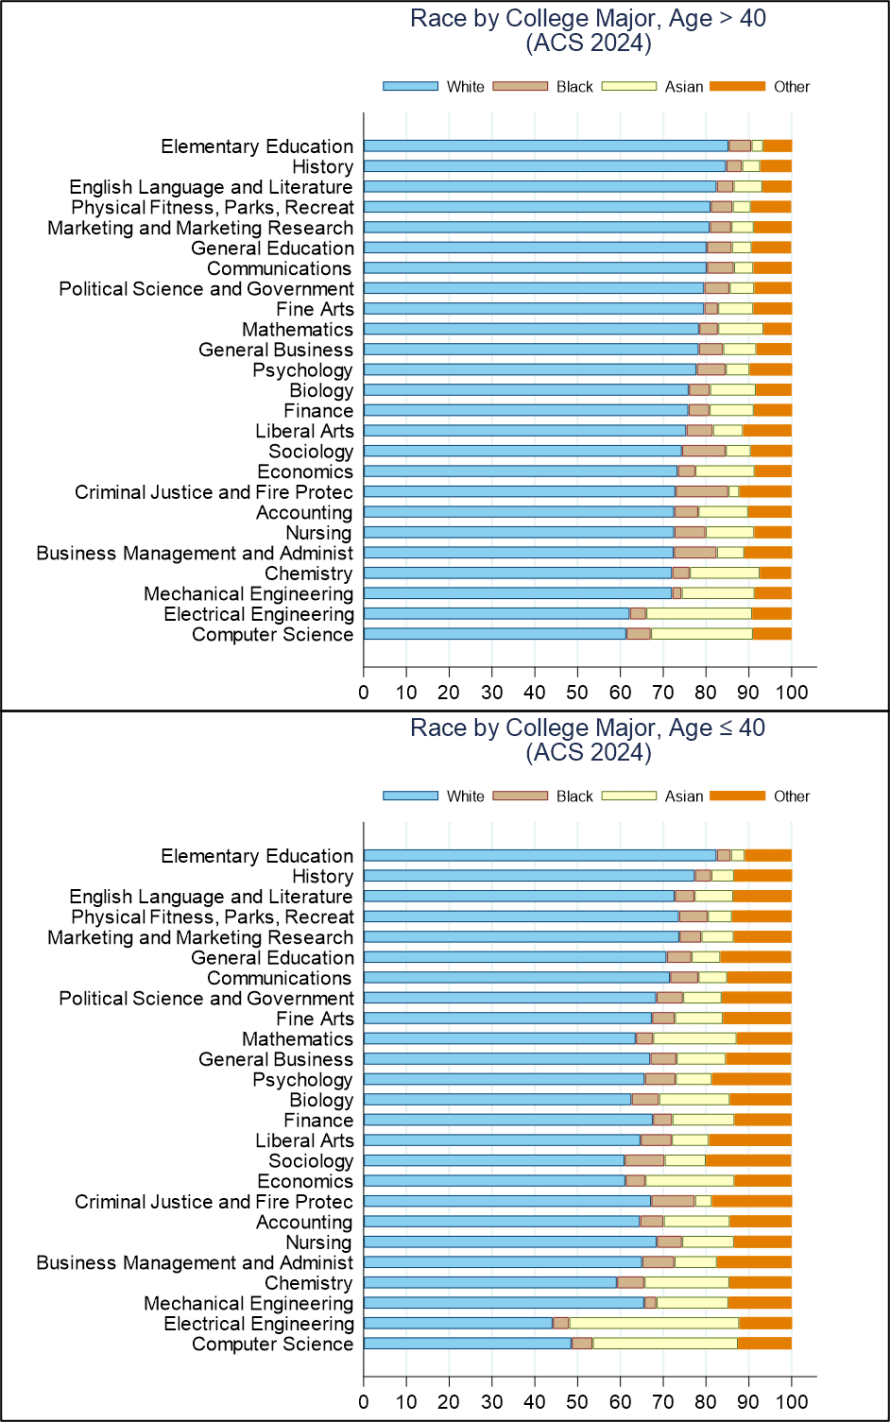
There are some stories that we tell. These include that we have increasing non-white and non-male participation in many college majors. Here I examine the 25 most popular majors in the 2024 ACS data and I split it up into older and younger cohorts, delineated by age 40 (unweighted).

Race

Below-upper is the distribution of race by college major for people older than 40 years of age, or who mostly graduated more than 15 years ago.  It largely conforms to my biases. There were a higher proportion of Asian people in the natural sciences and engineering, but also in Economics. I didn’t really have strong priors about the proportions of black people, but they composed the highest proportions in Criminal Justice, Business, and Liberal arts. Contrary to my expectations, Elementary Education had the highest proportion of white people. Below-lower is the cohort that is age 40 and younger. The entire distribution is  similar, but less white.

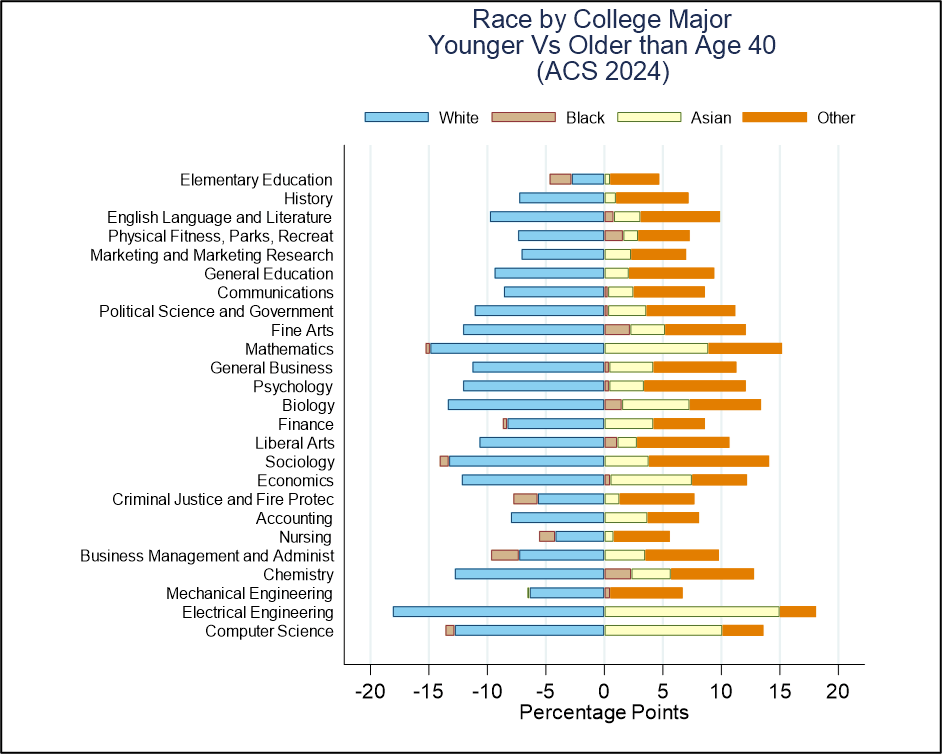
Some of the differences between the two groups are hard to see, so I’ve included those below. What are some general takeaways? 1) There are lower proportions of white people among all degrees. 2) There are higher proportions of Asian people in every field except mechanical engineering, which is unchanged. 3) Whether black people compose a greater proportion depends on the major.

In the younger cohort, black people are now a greater share of bachelor’s in chemistry, Fine Arts, Physical Fitness, Biology, and Liberal Arts. But black people also now compose lower proportions of people with bachelor’s in business management, Criminal Justice, and Nursing.

Interestingly, the whitest college major, Elementary Education, has experienced the least change in racial diversity and has had a decline in the proportion of black degree holders. Economics ties with Sociology with for the 4th lowest proportion of white people among younger graduates at 61%. Most of the criticism in economics has not been due to racial imbalance, but rather due to sex imbalances.

Sex

Because sex has two categories in the census data, I can fit everything into the single graph below. It illustrates the sex split by major among people older than 40 vs the younger cohort. The distribution mostly conforms to my priors. The biggest surprises to me among the older cohort are that Finance and Math were as popular among females as they were. Those are two fields in which I though men would compose a higher proportion, but Math is within a stone’s throw of an even split. Among the younger cohort of majors, the vast majority of degrees are more female now, though Economics is still around 2/3 male.

Continue reading →

Iso-Standard Errors & Unemployment By Major

Say that I want to calculate the unemployment rate by college major. That’s easy enough – we just divide the number of unemployed people by the number of people who are in the labor force. Repeat for each major.  The 2024 ACS includes all the variables we need, including employment status by week, but here I just calculate the annual average. I’ll calculate unemployment rates using the unweighted observations because I want to make a separate statistical point about simple standard errors.

Sample weights aside, we have some basic data maintenance to consider. The sample sizes for each major differ. Some majors include more than 15k people, while others have less than 100. Which majors should I include? All of them?

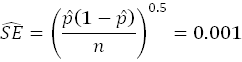
It depends on how precise I want the estimates to be – how small I want the standard errors to be. Below is the basic equation for the standard error (SE). Maybe I want my standard errors to be no more than 0.1%, since unemployment rates are on the order of 1-5%*. Then, it’s just a simple matter of setting the SE equation equal to 0.001 and solving…. Except that there are two variables. Getting a SE of 0.1% depends on both the sample size and the observed proportion. So, a basic rule such as ‘include only majors with at least 100 people won’t quite achieve what we want since the whole point of the exercise is that we suspect that the proportions of unemployed people differ among majors.

In order to get an idea of how many observations we need conditional on the proportion, we can use a popular tool in economics. Basically, adding the prefix “iso” to any term lets us see how two (or more!) other variables matter for the value of the term. We have iso-costs, iso-quants, iso-Sharpes, iso-retirement payments, etc. Here, we can have an iso-standard error by graphing the sample size on one axis, and the proportion on the other. With the desired SE as a constant, we can rearrange the SE equation so that  the sample size and proportion variables remain. They’re isolated below – solving for sample size is much simpler.  

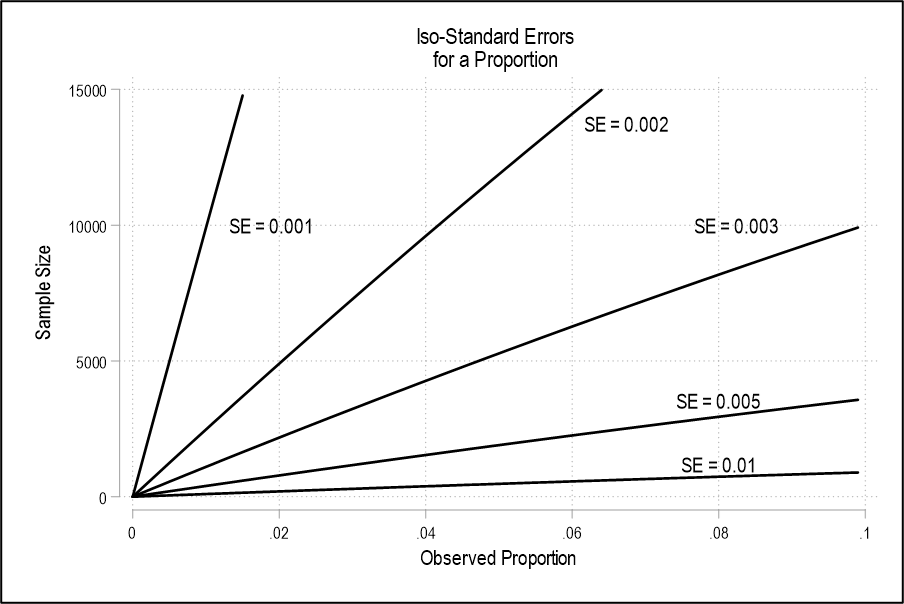
The above equations let us see all of the sample size and proportion combinations that yield an arbitrary standard error. We’re basically doing the first steps of what’s known as a power calculation. We’re setting up some guard rails before doing the analysis so that we know ahead of time whether we’d even be able to tell the difference between proportions with the sample sizes that we have. Below is the graph of the iso-SE to illustrate the sample size & proportion combinations that yield some target SEs. Pictured is the left side of parabolas. What does it tell us? It tells us that shrinking the target SE increases the necessary sample size at each proportion REALLY FAST.

Since the most college majors have a sample size that is well below 15k, we basically know ahead of time that we won’t be able to tell the difference between their unemployment rates if they differ by a mere tenth of a percent. Given that the national unemployment rate in 2024 was around 4% and around 2.3% for college majors, there’s not much room for error – literally. Everything looks the same when proportions are similar and sample sizes are small.

Continue reading →

Economics Major Income Premium

I’ve written about Economics major incomes before. The consistent empirical fact is that they earn more than most other college majors. But why? My working theory is that’s it’s due to human capital differences.

Challenge 1: Top Business Schools

“The highest ranked business schools offer economics majors with various business concentrations instead of separate business majors. So, the high average income of econ majors is due to those top tier finance concentrations and the like.”

This challenge doesn’t hold water. If the high average income were just due to top performers, then omitting them would break the pattern of high economic major compensation. But it doesn’t. Trimming the top and bottom 10% of incomes for each major doesn’t cause economics to fall much in the ranking.

Challenge 2: Econ Majors Choose Higher Paying Occupations

“Economists aren’t especially productive. They merely choose higher pay occupations. Other majors could achieve the same thing if they wanted to.”

This challenge is partially true. Economics majors do choose higher paying occupations. The Bureau of Labor Statistics has an extensive list of occupation categories and codes that are linked to the American Community Surveys. I examine the broadest categories that have sample sizes of at least 40 for each economics and other majors.  The below scatter plot shows the relationship between average income by occupation and the proportion of economics majors who chose to work in those occupations. There is clearly a positive relationship. Economics majors do choose higher paying occupations.

But the claim about productivity isn’t quite right. If economics majors were just as productive as other majors within their occupational category, then they would earn around the average income within each occupational category. But they don’t! Below is a chart that plots the average income premium over non-economics majors within each occupational category (error bars are one standard error).  The occupations to the left are more abstract or even social in nature. That’s where economics majors earn their big income premium. Further to the right are occupations that are more ‘hands-on’. Economics majors earn about the same as non-econ majors in those categories.

The one interesting case is ‘Computer and Mathematical’ occupations, which are abstract in nature and yet economics majors have no better earnings on average. Those occupations have a higher than typical proportion of Computer Engineering, Computer Science, Computer Information Systems, and Mathematics majors. Given that those majors 1) also have training in abstract theory and 2) are highly specialized, it’s impressive to me that economists can keep up.

Additionally, economics majors are not uniformly distributed across occupational categories. They tend to pursue occupations in which they have an advantage as indicated by their wage premium. The below chart has the same horizontal axis as the one above and has more mass further to the left. A higher proportion of economics majors are in the occupations where they outperform others in the same occupation.

Continue reading →

College Major & Income Sources

We already know that economists earn more income on average. But when and how one earns income matters for how you spend your time both now and in the future. Being more productive affords the option to earn more money by working. For that matter, it also affords the option of staying home or pursuing passion projects at work or elsewhere.  Earning more money earlier in life also has implications for how you spend your time later in life.

Specifically, given the choice, you may choose to work less as a young adult so that you can spend more time with your family. The tradeoff isn’t just whether to work now or spend more quality time with others. After all, money can be saved for the future. Choosing to work less (or for a lower salary) today means that you may choose to work more in the future in order to achieve your desired standard of living. Personally, assuming I make it to old age, I would very much like to afford spending time with my family.

The more that you earn earlier in life, the more that you can save and invest for the future. The more that you save, the more that you can enjoy the fruits of compound interest. It’s not just a matter of earning more now rather than later. If you work and save now, then your future income can be passive. That is, your future earnings won’t require you to spend your time in an office or otherwise employed. You can still do that if you want, but you wouldn’t *need* to.  By having more retirement, investment, and social security income, your future self will earn plenty of income without spending as much time formally working.  You can instead spend time with loved ones or on other pursuits.

Below is the stacked bar graph of average income sources over each decadal age cohort. All data is from the 2024 ACS, so it’s just a snapshot in time rather than following individuals over the course of their life. I singled out people with Economics, Finance, and other 4-year college degrees. Economists make the most lifetime income if we count salary and other compensation alone. But if we look at the older cohorts, economics majors also earn more passive income. You’d think that Finance majors would earn more from investments. But among people in their 70s, economics majors earn more investment and retirement account income. Finance majors do earn more social security in that cohort, however.

Continue reading →

Income By Major (ACS 2024)

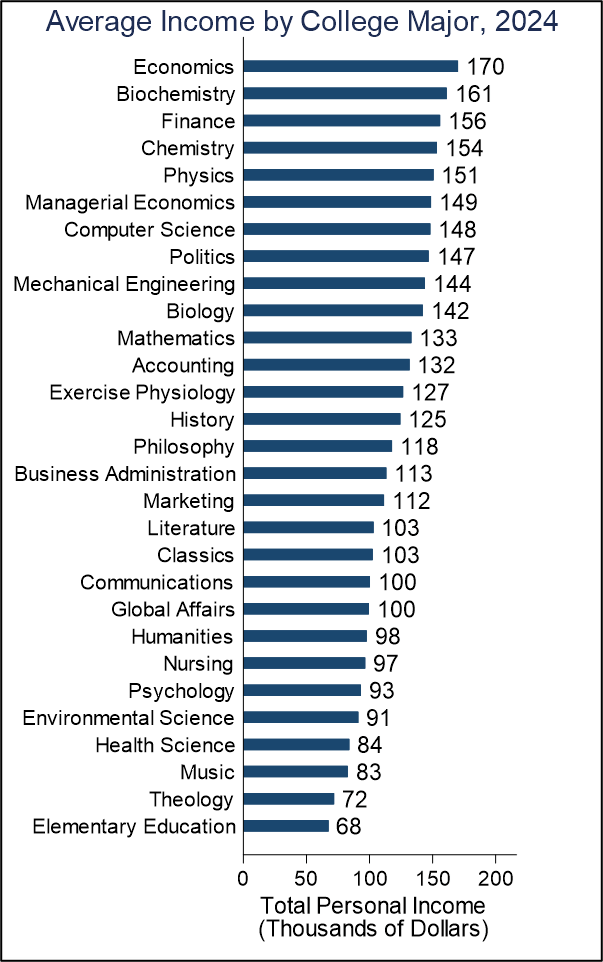
A chart showing the average income by major was recently making the rounds on social media. So, I tried to replicate it. It turned out that some of the college majors were omitted. That part actually makes sense. The 2024 American Community Survey includes 174 degree fields – which is way too many for a clearly labeled bar chart. So, for local advertisement, I used only the majors and their equivalents that are offered at my university.  That chart is below (unweighted).

These are just raw average earnings by college major for employed adults. They all have decent sample sizes. Below is the cumulate distribution of sample size for each major. The smallest sample size is 45 (Military Technologies) and only 3% have sample sizes below 100. Only 34% have sample sizes below 1k.

You better believe that my colleagues and I show this chart to every single one of our classes. Obviously, it’s truncated from the full 174 majors, but it’s the relevant chart for us. If we use the full sample of college majors, Economics ($170k) drops to 3rd highest income, behind “Petroleum Engineering” ($173k) and “Health and Medical Preparatory Programs” ($183k). To be perfectly honest, those latter two sound a lot more difficult and have surprisingly little pay bump in compensation. Being more difficult is also consistent with the smaller sample size Economics=13k, Petroleum Engineering=343, and Health and Medical Preparatory Programs=1,099.  

One challenge that I’ve heard about the chart is that top business schools, such as Wharton, have Economics majors and various business concentrations. So, those top performing financiers are getting categorized as Economics in a way that is a bit misleading to young students elsewhere who are trying to decide on a major. If that’s true, then we should see Economics drop in the rankings if we omit the top-most earners.  After all, the criticism is that they’re pulling up the average.

Continue reading →

Welcome Back to School: Potential College Students are Now Declining

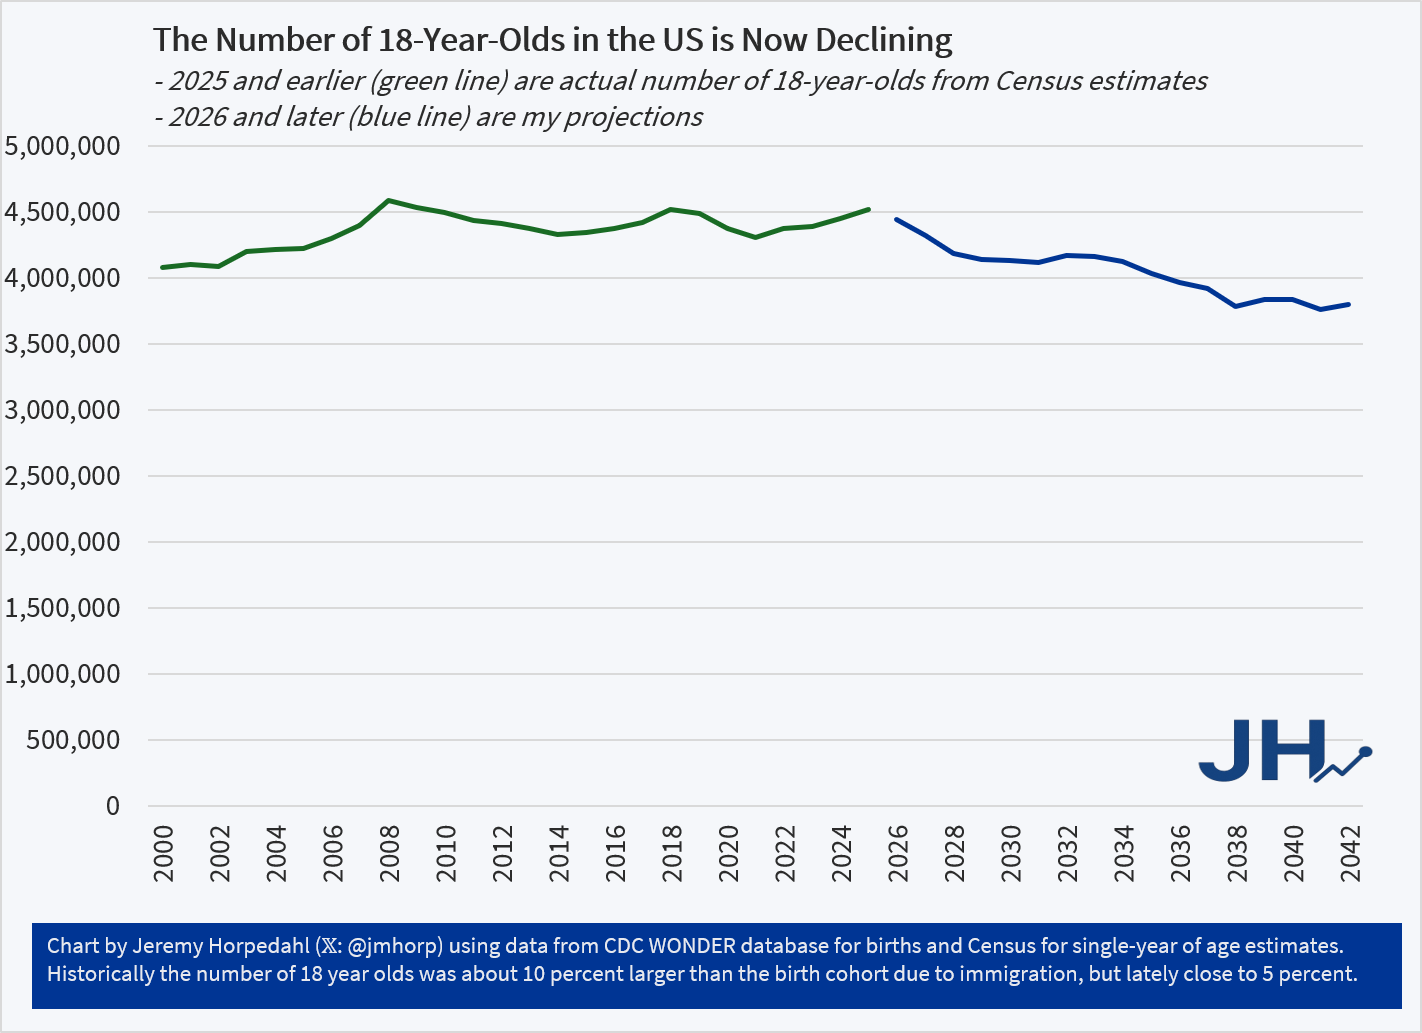
If you have spent any time around higher education lately, you have probably heard of the “demographic cliff” or “enrollment cliff” for years now. Well, it’s finally here. In terms of total number of births, the US peaked in 2007 at a little over 4.3 million births. That’s the highest year ever, even higher than the peak of the Baby Boom (not in terms of fertility rates, of course, I’m just talking about absolute number of births).

Babies born in 2007 turned 18 in 2025. But after 2007, births started to fall. In 2025, there were just about 3.6 million births, a decline of about 700,000 babies since 2007, or a 16 percent decline. The number of 18-year-olds won’t be exactly the same as the number of births in a given year: it’s actually usually a bit higher, as net immigration is much larger than the small number of children that die before they reach 18. For example, the 1982 birth cohort had 3.68 million babies, but 18 years later in the year 2000 there were 4.08 million potential college students.

Historically there have been about 10 percent more 18-year-olds than the birth cohort, but lately (2021-2025) it has only been about 5 percent higher than the birth numbers.

There are, of course, all kinds of social, economic, and political implications of falling births. I just want to mention one that is specific to the industry that I work in: potentially falling college enrollment. And because this enrollment will not be uniform across states and universities, this will cause serious budget issues for many colleges in the coming years.

Some folks in higher ed have lately been asking when the demographic cliff will hit. It’s here:

Announcing the Disability Records Project

Did you know that we have access to digital copies of the historical US census rolls? You can also find the digitized data at IPUMS. However, the data for people with disabilities is not great. It depends on the year, but those data have error rates on the order of 20% or higher.  We have the digital census rolls, the data just doesn’t match them.

So, I created a non-install windows computer application that lets people identify disabled people on those digital census rolls. Complemented with machine learning, my goal is to improve the accuracy of historical records about people with disabilities. Historical and quantitative research about disabled populations is relatively thin. We can do better. If you have students who would benefit from this research experience, then do please let me know! I can approve your institution’s email domain and we can get started.

The application is really straightforward with basically two user-facing features.

Continue reading →

Uncertainty Increases Profits?

Most people have an intuition that uncertainty can harm economic outcomes. Baker, Bloom, & Davis (2016) and Bloom (2009) demonstrated that industrial production and manufacturing decline in the face of policy uncertainty. The typical mechanism that people suggest is that uncertainty about the future causes people to engage in precautionary saving, resulting in fewer sales.

The theory continues that firms consequently decrease production as demand for their output declines. Firms aren’t interested in causing the quantities supplied and demanded to be equal. Rather, they don’t want to produce too many goods that don’t get sold or don’t get sold at an adequate markup. Production is costly.  A related theory is that more persistent or longer-run uncertainty can also depress investment, since the riskier future increases the tail risk of losses.

Rather than make a risky investment, one could instead just hold off and wait for some of that uncertainty to get resolved. There’s tradeoffs to this, of course. As future costs and benefits become clearer, they also get priced-in to asset values. So, there is an optimization problem. The possible downside outcome is big and uncertain. If the risk of the investment gets resolved and the downside outcome is still too likely or harmful, then a project manager did the ex-post ‘right thing’ by waiting.

But, if the downside risk disappears or is found to be very small, then waiting to invest in the project incurs an economic cost. Either 1) the profitable project and its associated profits will occur later and less valuably, or 2) other firms also resolve their uncertainty and bid up the price of the project’s inputs. Invest too early, and the downside is large and uncertain. Invest too late, and you may lose the potential upside partially or entirely.

But can uncertainty systematically increase profits?

Walter Oi said yes.

Continue reading →

Joy Explains how to integrate AI into a statistics class

I have put a working paper on SSRN describing three ways I incorporated AI into my Business Statistics 200-level class for undergraduates at Samford University in Spring 2026. Read the paper at the link.

Connecting Classroom Econometrics and Excel Training with Large Language Models (SSRN)

Abstract
Economics education almost always includes a component of statistics. Most undergraduate economics curricula require an upper-division econometrics course, and many economists teach data analysis. These courses help students become conversant with major contributions in economics research, but they can be challenging to teach. On its own, the mathematics of regression, error minimization, and statistical software may not feel exciting to students, especially compared with the intuitive economic reasoning that often draws them into the discipline. At the same time, students are increasingly interested in artificial intelligence and large language models. This note describes three practical teaching exercises designed to connect ordinary least squares, Excel training, and LLMs. The goal is to use students’ curiosity about AI to motivate classic statistical reasoning and practical spreadsheet skills.

The image is from ChatGPT 5.5 Thinking mode and it took over a minute to generate. The fact that their laptop screen is pointing away from them is funny (unrealistic). The portrayal of Tom Holland and Zendaya is good, which is what the audience cares about. So, this seems like a case of AI hallucinating up the thing that people want.

I posted back in February about the LLM Telephone game: Telephone Classroom Game for Teaching Large Language Models

Citation:
Buchanan, Joy, “Connecting Classroom Econometrics and Excel Training with Large Language Models” (May 27, 2026). Available at SSRN: https://ssrn.com/abstract=6839039

Note: I have been posting my papers to SSRN for a long time as a way to distribute them faster and more widely. I have heard rumors that SSRN might stop working, for my purposes. If anyone has suggestions for what I should do about the papers I have up there, please let me know! Or, if you are readying this post-summer-2026 and want a copy, send me a message at my Samford email so I can send you a copy.

arXiv will ban authors who submit papers with LLM mistakes

In the world of academic preprints, arXiv has long been the go-to platform for researchers to share work quickly. But with the explosion of generative AI tools, the repository is drawing a line in the sand.

On May 14, 2026, arXiv moderator Thomas Dietterich announced a clarified enforcement policy. If a submission contains incontrovertible evidence that authors didn’t properly check LLM-generated content, all listed authors face serious consequences.

What counts as “Incontrovertible Evidence”? The policy targets clear signs of unchecked AI output, including:

  • Hallucinated or fake references
  • Meta-comments left by the model (e.g., “Here is a 200-word summary; would you like me to make any changes?” or placeholder instructions like “fill in the real numbers from your experiments”)
  • Other obvious errors, plagiarized text, biased content, or misleading claims generated by AI

arXiv’s Code of Conduct already holds every author fully responsible for the entire paper’s contents.

The Penalty

  • One-year ban from submitting new papers to arXiv.
  • After the ban, future submissions must first be accepted at a reputable peer-reviewed venue before arXiv will host them.

At first researchers discussing the policy online seemed happy about the one-year ban, but when I pointed out that it is essentially a ban for life to use it at a pre-print venue, some people became nervous.

Why now? arXiv has been overwhelmed by low-effort “AI slop.” These papers are marked by fabricated citations and shallow summaries. This erodes trust in the entire preprint ecosystem.

In response to the complaints (someone like me would be worried that I’ll somehow let an error slip through and then be banned for life from posting working papers), Scientific Director Steinn Sigurðsson shared:

on the whole @arxiv flap about hallucinated references etc

you don’t see the stuff we reject… some of it is really really egregious

the decision to impose additional consequences is largely to throttle that stuff so n00bs and bad actors don’t trash us trying repeatedly

This is the problem that we face with every internet forum. A few bad actors ruin it for good people.

In 2022 I wrote Content moderation strategy

Elon Musk buying Twitter is the big news this week. He wants to enhance free speech on the site and, according to him, make it more open and fun. Some fans are hoping that he will make the content moderation and ban policy more transparent. Maybe that’s possible. 

If no one can be banned, then bad actors will bring the whole platform down. Inevitably, good people get caught in the net, and it’s devastating to be locked out of a platform where your peers are sharing.

However, if you want to be taken seriously by tech folk then ask for a system that is possible. A substantially better experience might be incompatible with the site being free to users.

Part of the problem that I don’t hear people talking about is that a free platform is not easily compatible with good customer service.

For some not-fake work and citations: Buchanan et al. (2024) provided early clear evidence that a mark of LLM-written work is fake citations. And, Buchanan and Hickman (2024) show that certain framings can prompt people to be more suspicious of AI-generated writing, such that they are pushed toward doing a fact-check before believing all claims.

Buchanan, Joy, and William Hickman. “Do people trust humans more than ChatGPT?.” Journal of Behavioral and Experimental Economics 112 (2024): 102239.

Buchanan, Joy, Stephen Hill, and Olga Shapoval. “ChatGPT hallucinates non-existent citations: Evidence from economics.” The American Economist 69.1 (2024): 80-87.