The conventional wisdom is that the NBA regular season has too many games. Teams play worse because they are tired, or injured, or resting their stars so they can be ready to actually play hard in the playoffs.
Teams on the second night of a back-to-back shoot less efficiently (lower eFG%), grab fewer offensive rebounds, and play at a slower pace. On defense, they allow opponents to shoot more efficiently, force fewer turnovers, and give up more free throw attempts and second-chance opportunities. Turnover percentage and offensive free throw rate did not change significantly, consistent with our conceptual framework’s distinction between effort-dependent and execution-dependent metrics. While not every metric changed significantly, the overall pattern is clear: second-night back-to-back scheduling is associated with a measurable decline in team performance
The effect sizes here tend to be small, around 0.5-2%, but they are statistically significant given that we studied over 20,000 games, and practically significant given how close NBA games are.
Max had the idea for this paper and wrote the first draft as a student in my Economics Senior Capstone class in 2025. After he graduated, I joined the paper as a coauthor to get it ready for journals. We share the data and code for the paper here.
I don’t think it’s a coincidence that movements like expressionism, impressionism, and abstract art took off after the invention of the camera. Photorealistic paintings are impressive, but once they are duplicating what a camera does, they’re less interesting.
We’re due for similar movements in other fields to emerge as reactions to AI. Like writing in a way totally different from how an AI would write- ideally better than an AI would write, but even writing worse than an AI can be interesting if it is at least different.
It’s still early days for both AI and our reactions to it. But since the release of ChatGPT in 2022, what is the good new essay or book that you’re most confident was not written by AI, one that was written in an almost deliberately extra-human manner?
Alan Greenspan died this week at age 100. He was the Federal Reserve chair during my entire childhood.
But since I wasn’t really following markets and macro at the time, I don’t think of him in terms of monthly announcements about interest rates. What I find most interesting now is the winding personal and intellectual path he took to become a long-serving Fed chair.
He studied clarinet at Julliard before later getting economics degrees at NYU. He supposedly attended the famous 1944 Bretton Woods conference that organized the post-war international monetary system- but as part of an orchestra, not as a monetary economist. In 1966 he coauthored “Capitalism: The Unknown Ideal” with Ayn Rand, where he argued against antitrust and consumer protection laws and for the gold standard. This may be why my intro macro professor Bobbie Horn always referred to Greenspan as “Ayn Rand’s boy toy”.
His advocacy for the gold standard is striking given that just two years later he would join the campaign of Richard Nixon, who took the US off the gold standard in 1971. Then Greenspan would go on to chair the Fed in the now-standard discretionary manner while making, as far as I can tell, no attempts to move it back in the direction of a gold standard.
While it’s unclear whether Greenspan’s unusual path improved his ability as a Chair, it was at least possible then to reach the office by his somewhat unusual path. Since his 1987 appointment the path to the highest appointed offices narrowed to include only more conventional candidates. Randy Barnett and Josh Blackman noted this in a 2015 article on the Supreme Court:
earnest, platinum-résumé’d law geeks have their eyes set on “the Big Bench,” so they keep tidy lives because they think they might someday face a confirmation hearing. It is an unfortunate reality today that to be a judge, you cannot hold vehement opinions prior to the nomination and confirmation process.
I see similar forces at work in economics, where the 50 economists who have a shot at being Fed Chair and the 500 who think they do all hold their tongues. But what does that mean for the kind of Fed Chairs we get?
the truth about SCOTUS-wannabes who “trim their sails” and limit their potential based on a fear of a future confirmation hearing: Such persons lack the character a justice needs…. “Courage is a muscle. You develop courage by exercising it. Sitting on the fence is not practice for standing up.” Imagine what it takes to live your whole professional and personal life as a “justice-in waiting.” These SCOTUS-wannabes spend their careers seeking the approval of others, in the hopes that one day they will be nominated because of their friendships across the political spectrum.
Barnett and Blackman argued that this should change, and I think this is now in the process of changing again:
Such willfully “stealth candidates” should be disqualified from consideration for the Supreme Court…. We need jurists who are fearlessly committed to the rule of law, reputation be damned…. Paper trails are an asset, not a disqualification.
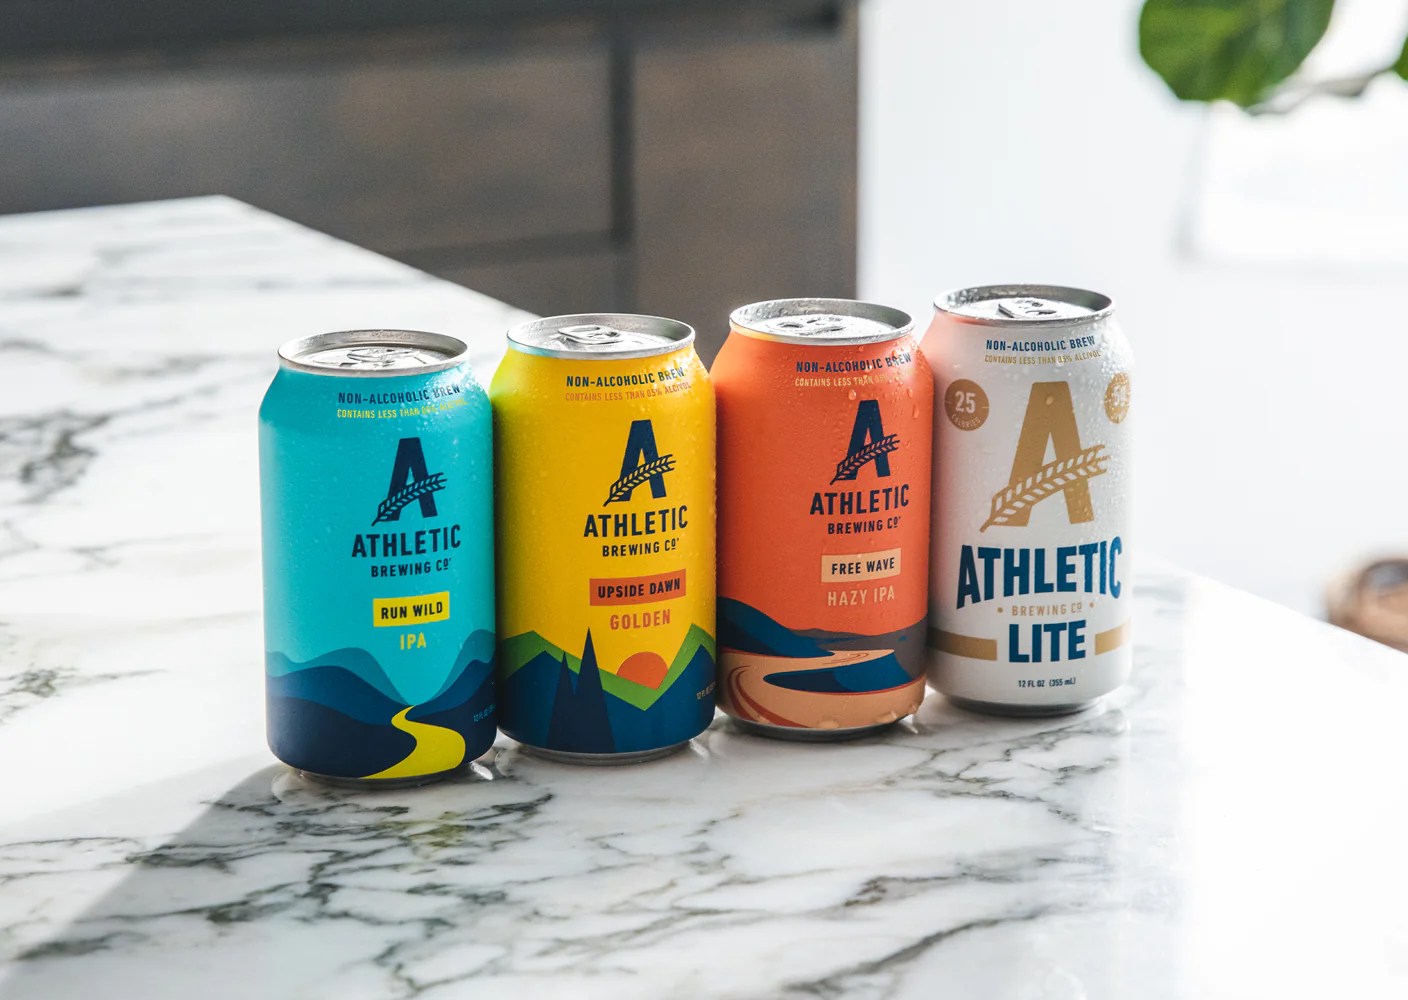
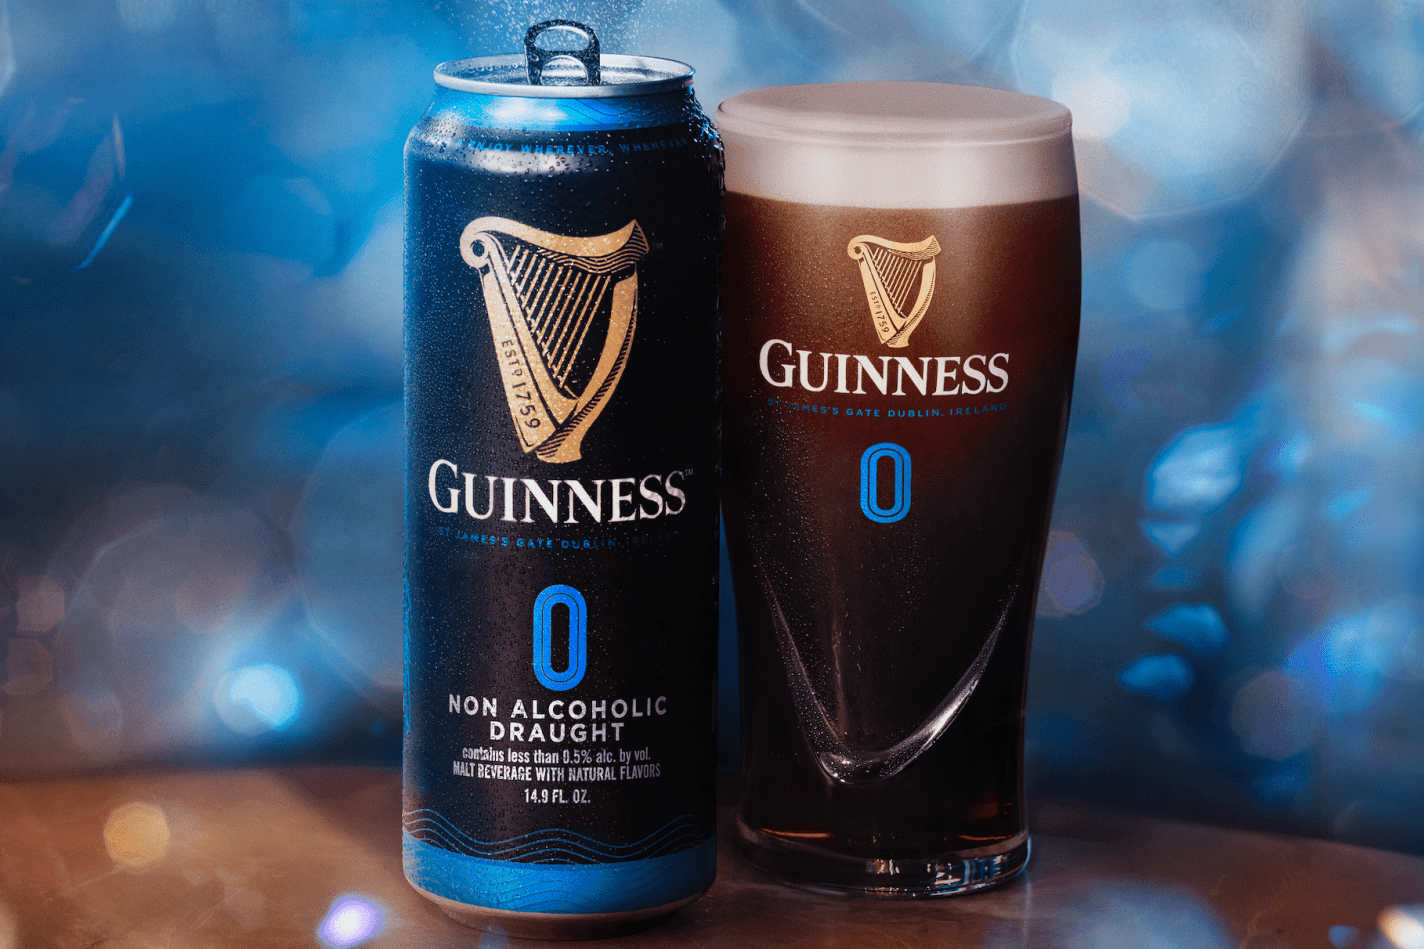
Non-alcoholic beer always used to mean O’Doul’s, which is a poor substitute for real beer.
Then Athletic Brewing cracked the code of how to make something that tastes much more like real beer.
Their new process and the higher demand that came with it have led to an explosion in variety, with many new and established breweries offering their own new NA beers.
I tried many of these recently when my wife was pregnant, and was pleased enough that I plan to keep drinking them. Partly as an occasional healthier substitute for real beer (less alcohol also means fewer calories), and partly as a nice drink to have with lunch or in the afternoon when I wouldn’t normally drink beer.
My recommendations:
Re-created the category, pretty good taste, easiest to find: Athletic Brewing
Best NA version of a beer you know: Guinness
Best NA beer from a brewery you probably haven’t heard of: Collective Arts Brewing, Emerald Dark
“Spirituous liquors might remain as dear as ever, while at the same time the wholesome and invigorating liquors of beer and alemight be considerably reduced in their price.” -Adam Smith
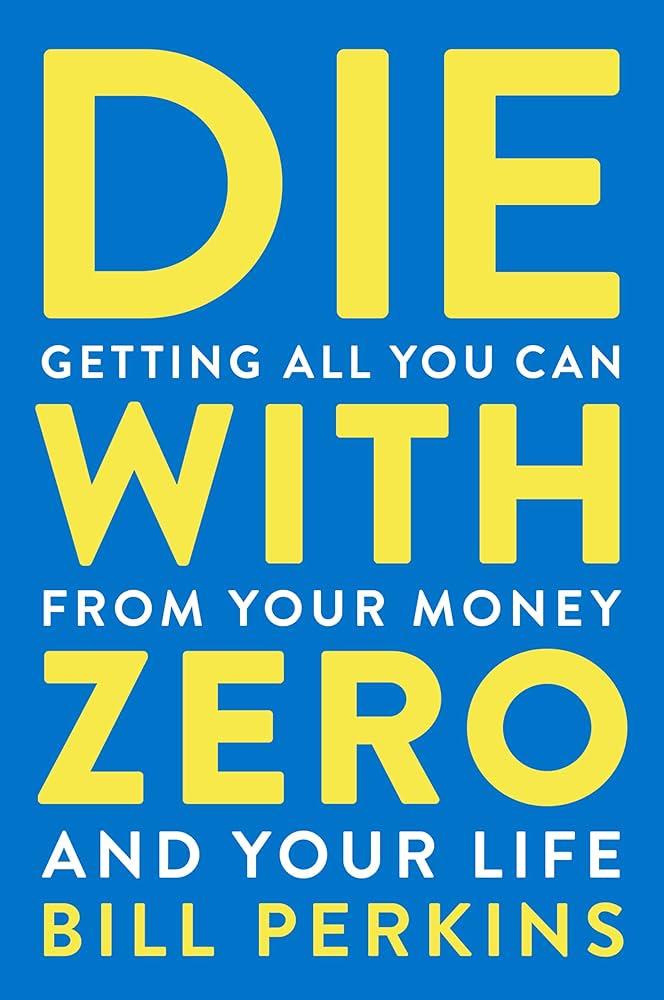
“Boomers- live it up now at the expense of your kids, the government, charities, and your future selves.” That’s what I worried the popular book “Die With Zero” by Bill Perkins* might advocate based on its title and the brief descriptions I heard. After reading it, I’d say it’s at most 20% the book I worried about. A more accurate summary would be “planning ahead is great but it doesn’t always mean saving more” or even “here’s how to plan out your optimal consumption path like an economist”.
The core argument is that you’ll be happiest if you spend or dispose of all your money while you’re alive, then die right as you run out of money. He acknowledges that “dying with exactly zero is an impossible goal” because you don’t know when you’ll die, but he thinks most people could get much closer to zero than they do and would be better off for trying.
He then considers a variety of obvious objections.
Q: Isn’t the risk of running out of money early worse than the risk of not spending everything?
A: It’s a real risk, but one that can easily be eliminated with financial products like annuities and long-term care insurance.
R (My reaction): This is basically right. In fact, the best argument for his thesis he seems to miss is that there’s also always Social Security and Medicaid, so in America you’d never really hit zero; still less so in a country with a stronger welfare state.
Q: What about kids? Or charity?
A: Figure out how much you want them to have, then give it to them before they die. They’d rather have it sooner- right now the modal recipient of an inheritance is 60 years old, but money is more useful to people when they are younger, closer to 30.
R: True as far as it goes, but my guess is that most people would end up giving much less this way. Especially if they also listen to Perkins’ advice about working less. He mentions giving money away early but his heart doesn’t seem in it compared to planning out the optimal consumption path.
Highlights: Your ability to enjoy your wealth depends on your health, since many fun activities can’t be done when you are frail or sick. It seems obvious when you hear it, but the idea of measuring the marginal utility of wealth with respect to health is underrated even in health economics. The book does lots of good work with data on Americans’ finances; maybe the best argument for Perkins’ idea that many people over-save is that 1/3 of Americans end up increasing their wealth after retirement.
Lowlights: Graph of optimal net worth by age (page 166) contradicts graph of optimal spending by age (page 172). Arguing that John Arnold should have retired earlier than he did (age 38) because he already had more than enough money for himself, without considering how this would have made one of the world’s most innovative and effective charities much less effective. Arguing that Warren Buffett should have given his money away sooner because the charities would rather have it sooner- arguably this is true for most people, but definitely not for the one guy who really can beat the market and give much more later!
Do I recommend Die With Zero? It’s a quick and easy read that I enjoyed, but I don’t think it changes any of my financial plans. If we over-simplify its message to be “consume more now”, it’s a bad message for the typical American (who saves only 2.6% of their income), but perhaps a good message for the typical reader of personal finance books. As always it’s good to ask yourself “who is this for” and “should you reverse any advice you hear”.
“the people I’m writing for- people who are saving too much for their own good” -Die With Zero
“Objectivism might be a vicious cycle. The people who are already too selfish see an opportunity to be selfish with a halo. They join Objectivism, egg each other on, and become even more selfish still. Meanwhile, the people who could really have benefitted from Objectivism, the people who feel guilted into living for others all the time while ignoring their own needs, are off in some kind of effective charity group, egging each other on to be even more self-destructively altruistic….. Every piece of social commentary is most likely to go to the people who need it least.” – Scott Alexander
*Bill Perkins is the only name on the cover, but the Acknowledgements and the ending note that the book was co-written by Marina Krakovsky with some work done by economist Kay-Yut Chen.
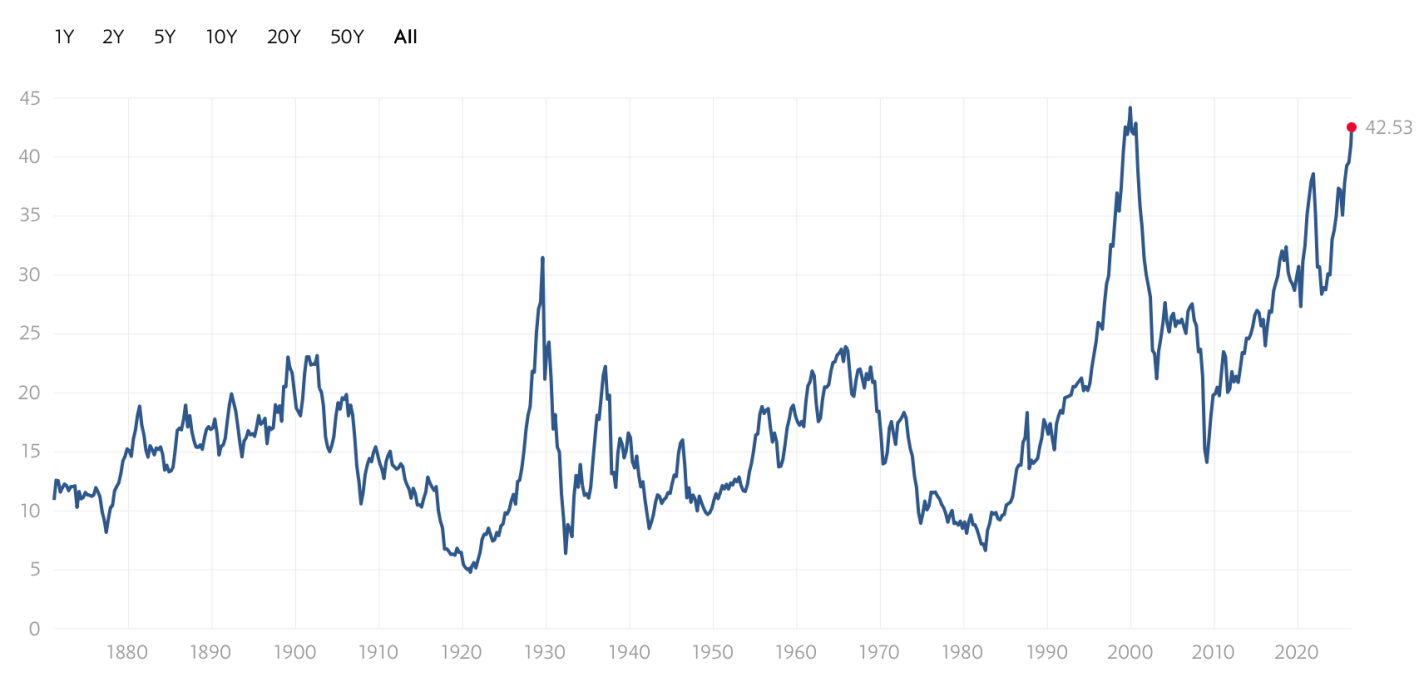
It’s feeling like the late ’90s, with an impressive new technology pushing tech stocks and the broader US market to all-time highs. Retail investors are using new platforms to get in on the action, tech companies are doing more IPOs to take advantage of the higher stock prices, and other companies are trying to boost their stocks by saying they are pivoting to the new technology (though often they aren’t really changing).
The excitement drives valuations to record levels:
Shiller CAPE Ratio
In the ’90s, the internet really was a transformational new technology that would enable lots of profitable new companies. But the market got ahead of itself, a bubble that led to a crash- the S&P fell by almost half, while the tech-heavy NASDAQ fell by over 3/4 and took 15 years to recover.
History rhymes, but it doesn’t repeat exactly. I don’t currently expect a big crash driven by AI stocks; it helps that unlike in the ’90s, many of the big players are currently profitable. But I also don’t expect the NASDAQ to keep posting 20+% returns every year.
If the AI bull market doesn’t end in a dramatic crash, how will it end? It’s already shrugged off a war. A US recession is unlikely this year, though plausible next year.
The end I see slowly approaching comes from crowding out. What Robert Solow said about computers in 1987 is true about AI today: you see the AI age everywhere except the productivity statistics. There’s only so much money to go around in markets when productivity growth is unexceptional and savings rates are falling.
We’re already seeing the war hit certain markets (if not US stocks). Iran’s gulf neighbors are now putting lots of money into missile defense, money they now won’t be spending on data centers or gold (down 16% from pre-war), and everyone else has to spend more on oil.
Interest rates have been rising- partly due to central bank attempts to fight inflation, partly due to ongoing high rates of government borrowing, and partly due to financing the AI buildout itself. Higher rates make it more expensive for companies to invest in the physical AI buildout, and make investors discount future AI revenues more while making bonds a more attractive substitute for stocks today. 10-year TIPS now yield 2% over the inflation rate, a sharp contrast to the 2021 stock boom when they yielded less than inflation. If I were older I’d be loading up on TIPS, and even at 38 I’m starting to get tempted.
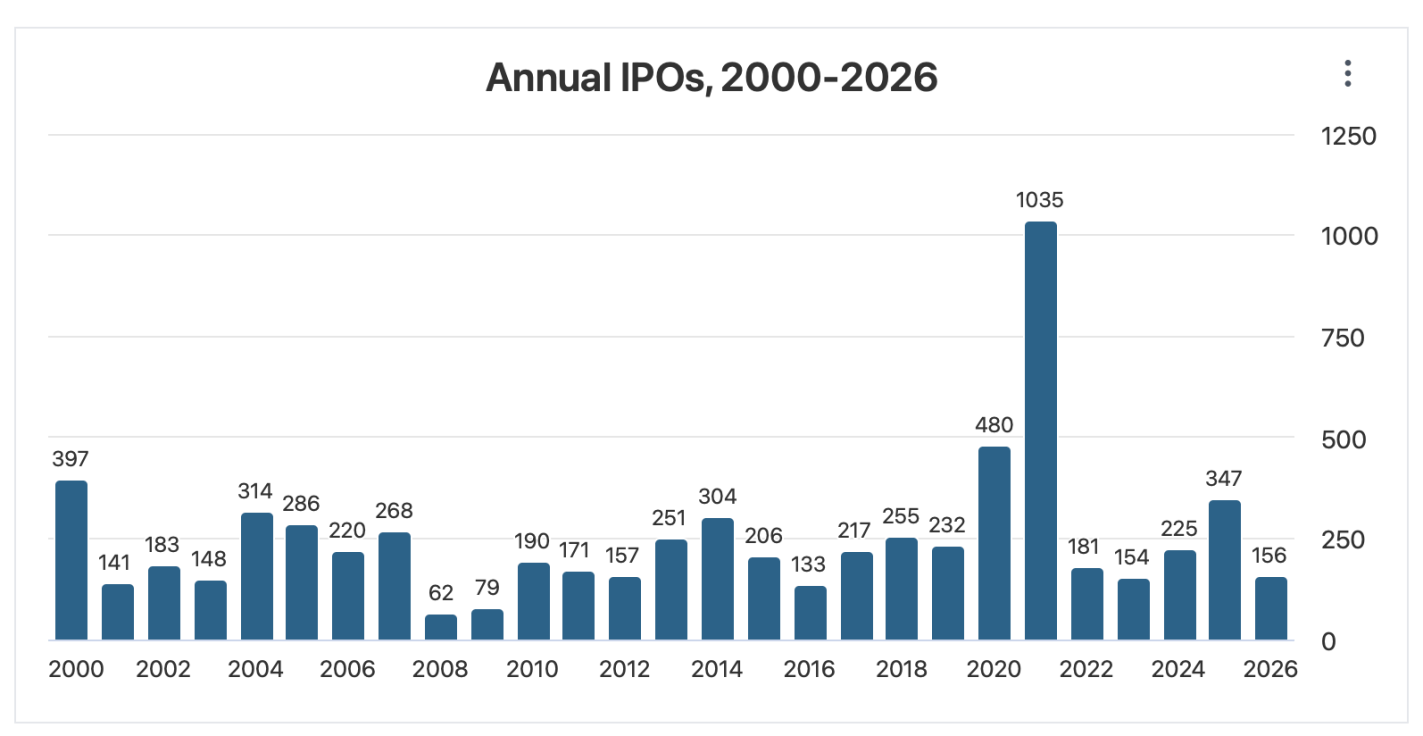
Trying to call the top exactly is a fool’s errand, but if I were feeling foolish, I’d point to the big upcoming IPOs. SpaceX just filed for an IPO that would be the biggest ever both for the amount of money raised ($75 billion) and the total company valuation ($1.77 trillion). This shatters the previous records for the biggest overall raise ($29 billion raised by Saudi Aramco when it went public in 2019) and the biggest raise by an American company ($18 billion raised by Visa in 2008). OpenAI and Anthropic are likely to follow with IPOs that would also break the previous records- making 3 companies each trying to raise more than the $45 billion raised by the entire US IPO market in 2025. Even if the process of going public doesn’t reveal any flaws in the companies, that money has to come from somewhere- and it takes up a substantial proportion of all net inflows to US stocks in a typical year (IPOs plus new money into existing stocks).
In short- where will the money come from? What are investors going to sell in order to buy into these IPOs? Technically they could do it all with cash, but I think it’s at least plausible that they start selling other stocks. The selling pressure will continue after the IPOs as employees of the newly-public companies see their stocks vest and other early investors become able to sell off.
I’m not trying to time the market. Even if this is a ’90s re-run, we could easily still be in the 1998 buildup, not the 2000 peak and crash. But I am diversifying. US stocks are currently the world’s most expensive. Investors value US stocks that highly because there’s a real chance that US companies are profitably building the technologies that will drive the future. But there’s also a real chance they aren’t– and if that state of the world comes to pass, I’d prefer to own a significant chunk of bonds, foreign stocks, and real assets.
I heard so many recommendations to read Julius Caesar on the Conquest of Gaul and Winston Churchill on the Second World War– and the recommendations were right. We’re incredibly lucky that some great wartime leaders also happened to be great writers who chose to take the time to share their perspective on the history they helped make.
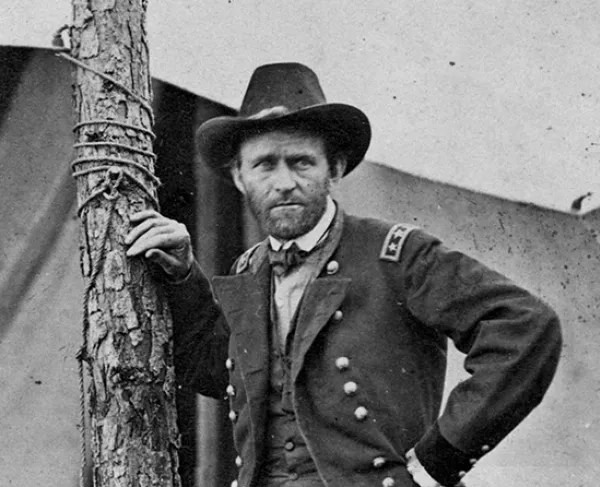
I rarely heard Ulysses S Grant mentioned as being in the same class of writer- but after reading his memoirs I think he should be. He was obviously a central wartime leader like they were, the highest-ranking general in the victorious Union army by the end of the US Civil War. But I’d never heard how he was also a great writer. He makes history like the campaigns of the Mexican and Civil wars feel understandable, while also sharing funny human stories. Some of these asides feel like they could have been written by Mark Twain, who did in fact help Grant edit and publish his memoirs.
It’s the rare doorstopper book that I wish were much longer- Grant was a two-term US President but his memoirs don’t cover those years at all. I don’t know how much of this is because he wanted to avoid the topic (he’s usually considered a much better general than president) and how much is that he simply ran out of time by dying of cancer.
A few highlights to give you an idea of what Grant was like. Certainly more like a modern economist than I expected:
Who benefits from trade between the US and China? If China subsidizes their exporting industries, should the US see this as a threat that undermines our industries, or thank China for lowering prices for US consumers? Does it matter that China runs a persistent trade surplus (exporting more than they import), while the US runs a persistent trade deficit?
Everyone has a take on these questions, but the answers I hear even among economists rarely draw from the leading modern models in the international trade literature. Krugman (1980) (10k citations) shows how large home markets matter for industries with increasing returns to scale. In a simple increasing returns model, unlike with Econ 101 comparative advantage, temporary subsidies can permanently flip which country an industry efficiently operates in.
Melitz (2003) (20k citations) extends the Krugman model to include firm-level productivity differences. Rubini (2014) extends the Melitz model to include innovation. Now Xiao (2025) has extended the Rubini model to include unbalanced trade, then calibrated the model with data from the US and China. Now that the mathematical models are able to incorporate more and more features of the real world, what do they show?
China’s trade surplus and the US trade deficit have tradeoffs. Specifically, China’s trade surplus leads them to be more productive than they otherwise would be, but have lower welfare, because so much of the fruit of their production is enjoyed by other countries. Conversely the US trade deficit leads us to produce less than we otherwise would, but to have higher welfare thanks to consumers enjoying the cheaper foreign goods.
In one sense this recapitulates some of the same debates people had without the math. Some people like trade because it benefits US consumers and overall present-day US wellbeing. Some don’t like it because it harms US manufacturing and our resiliency in any potential future conflict.
One advantage of the models is that it puts numbers on the tradeoffs. In this case, the welfare benefit to the US may be small relative to China’s welfare loss and relative to both countries’ productivity changes:
the average productivity increase caused by trade surplus ranges from 1.2 percentage points to 5.46 percentage points when the innovation cost changes. These results explain China’s long-term export promotion policies and align with its new policy goal of developing “new productivity forces”. I also identify a negative effect on China’s trade partners’ productivity (namely, the US), of between -2.74 percentage points and -5.89 percentage points. This comes at a welfare cost, equivalent to between 3 percentage points and 5.7 percentage points of consumption units. Correspondingly, China’s cheaper goods increase welfare in the US by between 0.26 percentage points and 1.22 percentage points
In addition to the big complex model, Xiao’s paper shares nice background on the sheer size of Chinese export subsidies, noting that they account for 2/3 of all manufacturing subsidies in G20 countries, and that export tax rebates are almost 2/3 as large as Chinese net exports. In short, China’s trade surplus is not simply driven by differing preferences and production capabilities across countries, but is largely driven by deliberate policy choices.
P.S. The paper’s author, Aochen Xiao, is on the econ job market.
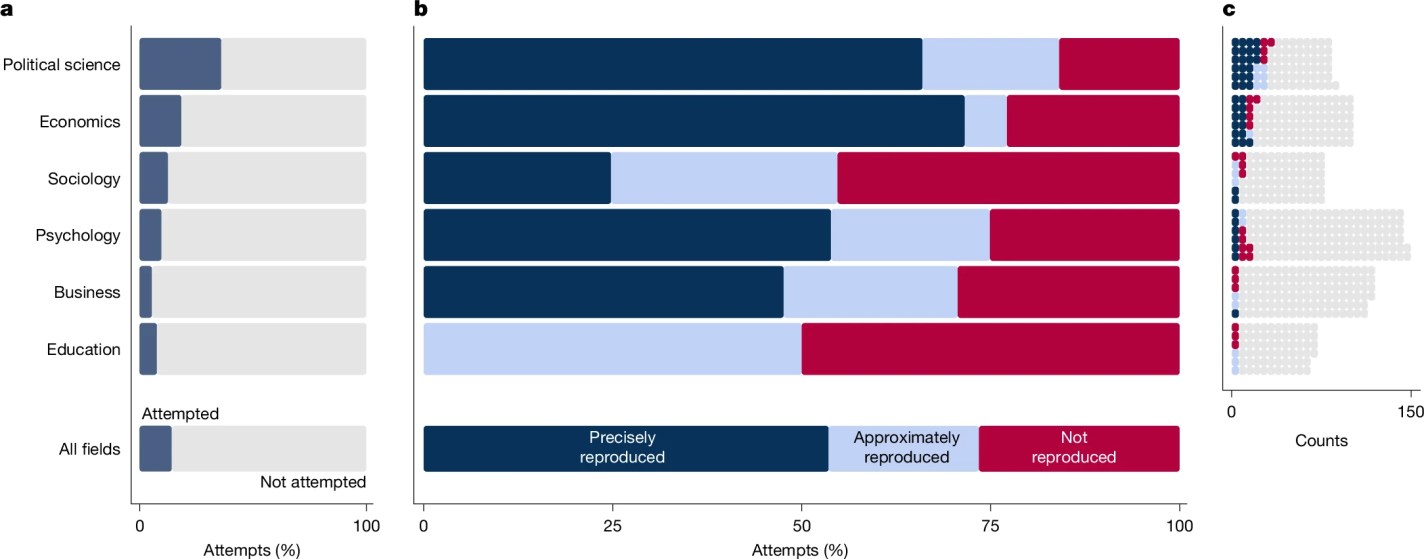
As a new quick rule of thumb inspired by the Nature papers, you could do worse than “cut estimated effect sizes in half”. If a published paper says that a college degree raises wages 100%, then chances are the degree really does raise wages, but more like 40–50%. In 2005, John Ioannidis said that “most published research findings are false”. By 2026, we seem to have improved to “most published research findings are exaggerated.”
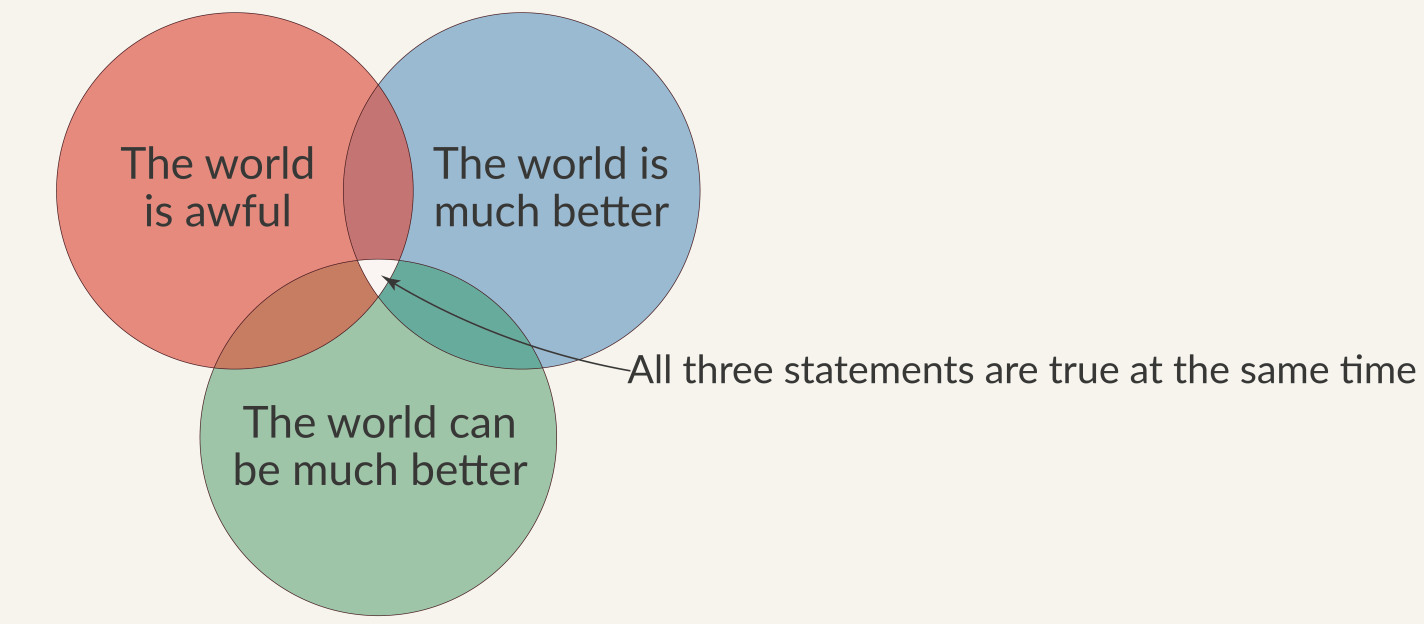
There’s plenty of both good and bad news for economics and the social sciences in both my piece and the Nature special issue it describes. It’s kind of like the Our World in Data motto:
In short, our attempt to replicate hundreds of papers showed that published social science results shouldn’t be trusted precisely today, but they seem to be getting more reliable over time, and they are much more reliable than chance. Economics and political science look the best, though we are still very far from perfect: