I have a new essay up at Human Progress today. Here’s a slice of it:
The productivity slowdown is not an immutable law of nature. It is, at least in part, the consequence of policy choices. Human ingenuity remains as powerful as ever. We have more scientists, more capital, and better tools than any previous generation. The challenge is not generating ideas; it is allowing those ideas to spread.
…
An additional one or two percentage points of annual productivity growth may sound insignificant. Yet when compounded over decades, the effects are transformative. Higher productivity means higher incomes, better health outcomes, more abundant energy, and greater opportunities for future generations. The ideas already exist. The question is whether we will allow them to flourish.
It’s feeling like the late ’90s, with an impressive new technology pushing tech stocks and the broader US market to all-time highs. Retail investors are using new platforms to get in on the action, tech companies are doing more IPOs to take advantage of the higher stock prices, and other companies are trying to boost their stocks by saying they are pivoting to the new technology (though often they aren’t really changing).
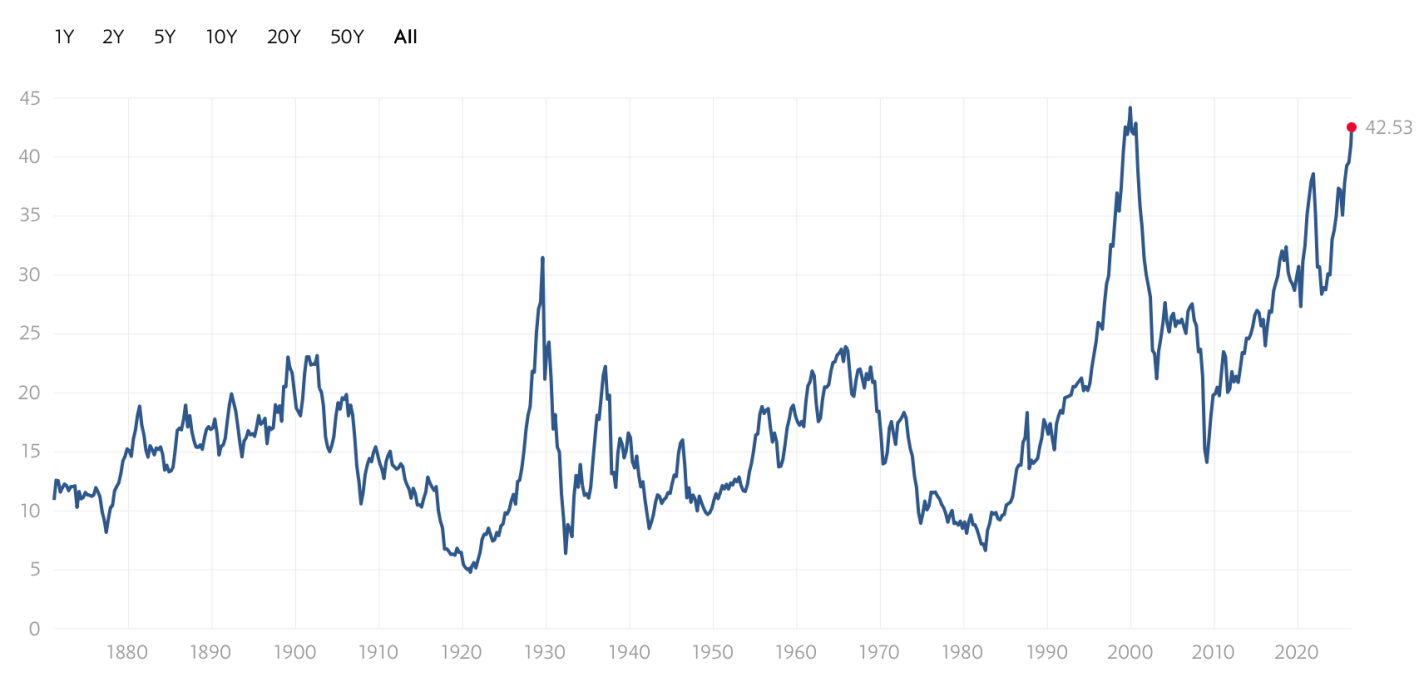
The excitement drives valuations to record levels:
Shiller CAPE Ratio
In the ’90s, the internet really was a transformational new technology that would enable lots of profitable new companies. But the market got ahead of itself, a bubble that led to a crash- the S&P fell by almost half, while the tech-heavy NASDAQ fell by over 3/4 and took 15 years to recover.
History rhymes, but it doesn’t repeat exactly. I don’t currently expect a big crash driven by AI stocks; it helps that unlike in the ’90s, many of the big players are currently profitable. But I also don’t expect the NASDAQ to keep posting 20+% returns every year.
If the AI bull market doesn’t end in a dramatic crash, how will it end? It’s already shrugged off a war. A US recession is unlikely this year, though plausible next year.
The end I see slowly approaching comes from crowding out. What Robert Solow said about computers in 1987 is true about AI today: you see the AI age everywhere except the productivity statistics. There’s only so much money to go around in markets when productivity growth is unexceptional and savings rates are falling.
We’re already seeing the war hit certain markets (if not US stocks). Iran’s gulf neighbors are now putting lots of money into missile defense, money they now won’t be spending on data centers or gold (down 16% from pre-war), and everyone else has to spend more on oil.
Interest rates have been rising- partly due to central bank attempts to fight inflation, partly due to ongoing high rates of government borrowing, and partly due to financing the AI buildout itself. Higher rates make it more expensive for companies to invest in the physical AI buildout, and make investors discount future AI revenues more while making bonds a more attractive substitute for stocks today. 10-year TIPS now yield 2% over the inflation rate, a sharp contrast to the 2021 stock boom when they yielded less than inflation. If I were older I’d be loading up on TIPS, and even at 38 I’m starting to get tempted.
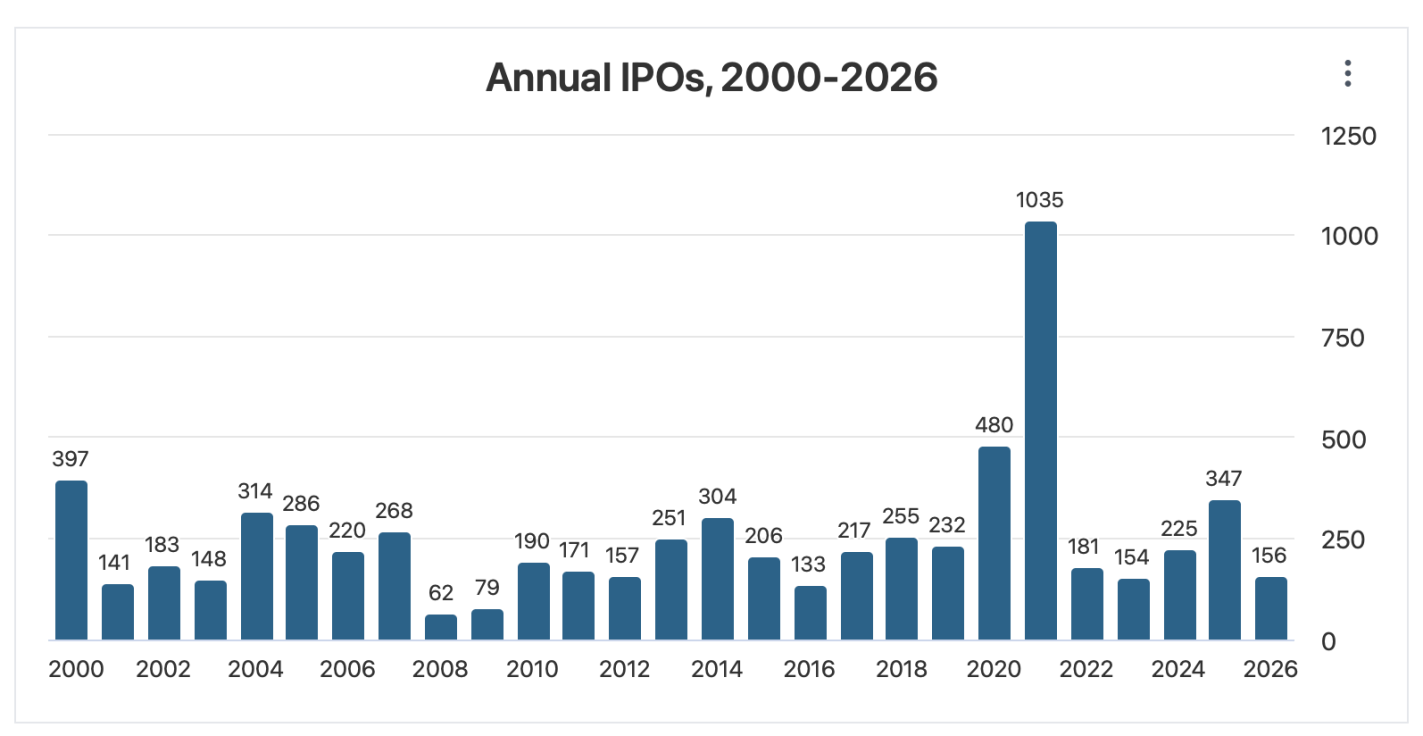
Trying to call the top exactly is a fool’s errand, but if I were feeling foolish, I’d point to the big upcoming IPOs. SpaceX just filed for an IPO that would be the biggest ever both for the amount of money raised ($75 billion) and the total company valuation ($1.77 trillion). This shatters the previous records for the biggest overall raise ($29 billion raised by Saudi Aramco when it went public in 2019) and the biggest raise by an American company ($18 billion raised by Visa in 2008). OpenAI and Anthropic are likely to follow with IPOs that would also break the previous records- making 3 companies each trying to raise more than the $45 billion raised by the entire US IPO market in 2025. Even if the process of going public doesn’t reveal any flaws in the companies, that money has to come from somewhere- and it takes up a substantial proportion of all net inflows to US stocks in a typical year (IPOs plus new money into existing stocks).
In short- where will the money come from? What are investors going to sell in order to buy into these IPOs? Technically they could do it all with cash, but I think it’s at least plausible that they start selling other stocks. The selling pressure will continue after the IPOs as employees of the newly-public companies see their stocks vest and other early investors become able to sell off.
I’m not trying to time the market. Even if this is a ’90s re-run, we could easily still be in the 1998 buildup, not the 2000 peak and crash. But I am diversifying. US stocks are currently the world’s most expensive. Investors value US stocks that highly because there’s a real chance that US companies are profitably building the technologies that will drive the future. But there’s also a real chance they aren’t– and if that state of the world comes to pass, I’d prefer to own a significant chunk of bonds, foreign stocks, and real assets.
Somewhere in the vast metropolis that stretches from Boston to Washington lives a friend of ours with a long-term dream. To protect her privacy, I will not give her name or town. For over thirty years she has wanted to do some form of homesteading, where you raise most of your own food, plus some extra to sell for cash. She and her husband contemplate moving someday to a rural area in the South, where they could buy cheaper land in a warmer climate to raise goats or pigs or cattle, and grow more extensive crops.
However, that move just never happened (so far), what with the usual limitations on jobs and finances. She decided a few years ago, though, to not just keep putting food production off forever. She is doing what she can, with considerable help from her husband, on an urban/suburban lot of just over a quarter acre. He constructed numerous raised beds in an area that was formerly just grass, and had many trees taken down to admit more sunlight. She sprouts seeds into plants indoors, to get a head start in the spring.
It started about ten years ago, with just two raised beds. Now the garden area looks like this:
….
Those are pictures I took near the beginning of May. By the end of May, the gardens had exploded:
Plantings there include potatoes, onions, squash, peas, peppers, garlic, tomatoes, strawberries, arugula, and lettuce. The brassicas such as cabbage, broccoli, kale, and cauliflower are covered with a tent; otherwise, cabbage moths can decimate these plants. In a rock bed they have horseradish and comfrey. They have four blueberry bushes. The next big project would be an asparagus bed.
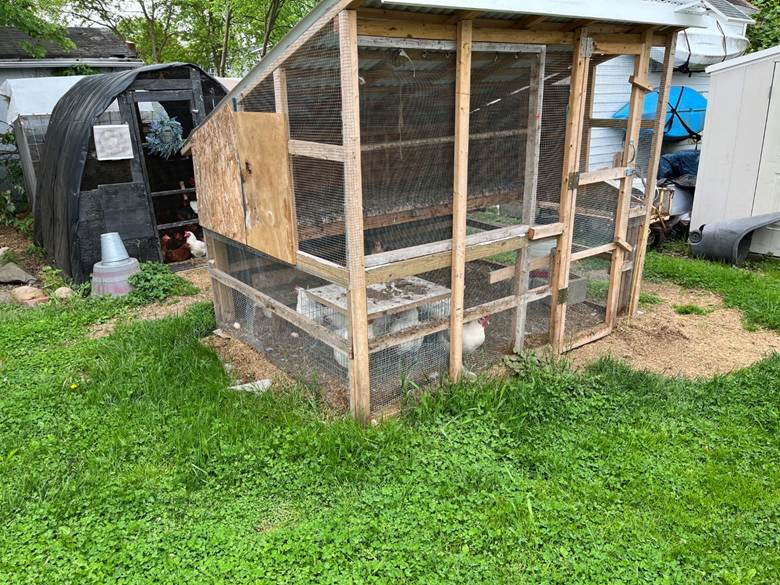
For livestock, they put in chickens about four years ago. In the foreground is a self-contained coop with about 8 birds, and behind it is a second coop with a run behind it, which houses about 18 birds:
They are raising dual-purpose chickens, which are pretty good egg layers, and OK for meat. (There are some breeds that are champs at laying eggs, and others like Cornish Cross whose purpose in life is to grow to eating size in an astonishing 8 weeks). All told, they get some 7-10 dozen eggs a week, spring/summer/fall. This is enough for them to eat and have plenty to sell or give away. In winter, with the cold and shorter daylight, egg production drops to 1-2 dozen/week. To transform a walking, clucking bird with feathers into breasts and drumsticks is a task I will gloss over here, but that is something that homesteaders also must do.
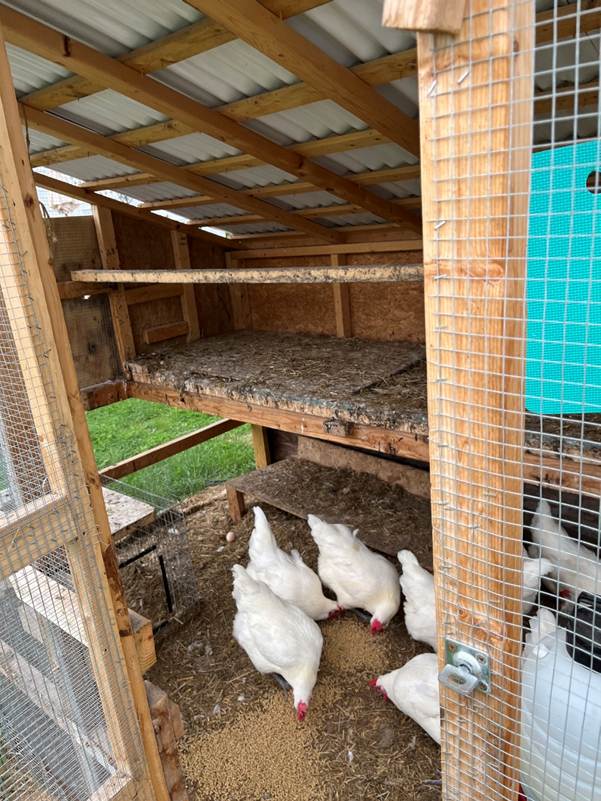
The main ongoing work with their chickens is filling the 7-gallon waterers every couple of days, and throwing a scoop of feed onto the floor of each coop every day. These birds get a “salad” of greens at least once a week, for variety. Here is a shot of the “girls” eagerly pecking away at their dinner; I see at least one egg on the ground in the background:
Chicken poop is pretty nasty, but it is managed by a deep bed system. There are several inches of straw in the bottom of the coops and the run. The birds continually dig around in the straw and mix it. That seems to dilute and dry the poop enough that the “farmers” only need to change out the litter a couple times a year. It just goes on the compost pile, to become fertile planting soil.
Chickens seem to be the most popular animal for budding homesteaders. They are called the “gateway animal”, to get you started/hooked. They tend to require little management, and are versatile eaters, so you don’t need to feed them just purchased grain. Some homesteaders feed them select table scraps, and even raise worms to feed the birds. If you have a large yard or pasture, you can put chickens in a movable “tractor” coop during the day, to forage for insects and greens in the fresh grass under the tractor for that day’s position.
Regulations on selling slaughtered meat are onerous, but it is easy to sell fresh eggs. In their township, chickens are allowed, but no roosters. (No one wants to hear crowing at 3:00 AM). So, our friend’s chicks that hatch out as males end up going to “freezer camp” just before they fully mature. Livestock such as goats and pigs are legal. Our friend wanted to raise a couple of pigs (pigs can also put on weight at an impressive rate, mushrooming from a 50-pound piglet to a harvestable 400-pound hog in 6-7 months). Her husband, however, declined to support that odiferous project.
Growing food is one thing, preserving it for later eating is another. She wrote me:
I can everything. Fruit, jams, veggies, potatoes, meat, fish, and meals. I have chili in jars, along with lamb stew, and onions for Frech onion soup. I make spaghetti sauce too. Yes, I’ve canned our own homegrown chicken.
Since [the storage room] stays cool in the winters (60ish F) I can store hard skin squash and keep fresh potatoes for frying or baking til January or February. I also dehydrate herbs/veggies and meat and fruit. Some veggies don’t can well, they get mushy like zucchini.
“Canning” in this context does not mean sealing into metal cans like you see in stores. It usually means putting the food in special glass “Mason” jars, heating them in a hot water bath (or, better but more work, in a pressure cooker) to sterilize the contents, then sealing them with a lid. Seems like a lot of work, but I am told by friends from the old South that canning your vegetables was a normal household activity there well into the 1960s or so.
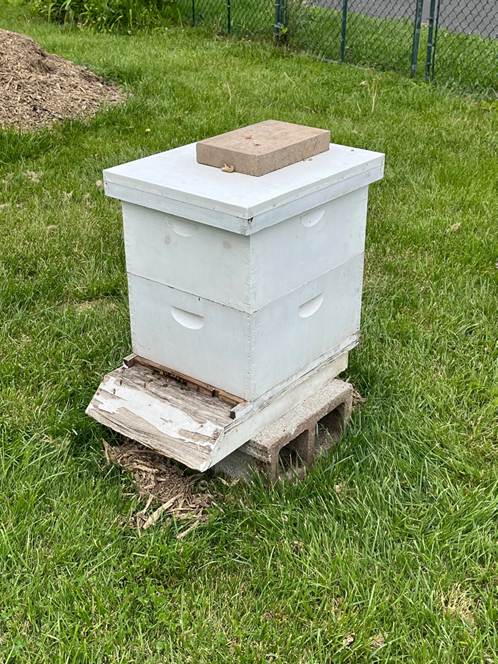
Finally, our friends have a beehive on loan from a neighbor. Zoom in to see the bees going in/out at the bottom:
I found it inspiring to see what this couple was able to accomplish in the way of food sufficiency in a quasi-urban setting, and I wish them well in their quest to relocate to where they can grow their own red meat and hear their rooster crow.
According to Claude: Windows 11 includes a built-in “Windows Scan” app (free in the Microsoft Store) that lets you scan documents directly to PDF — simple and reliable for everyday use. “Adobe Scan” offers a free mobile companion but also works via browser. For more features, “NAPS2” (Not Another PDF Scanner 2) is a popular open-source option with batch scanning, OCR, and direct PDF export. “IrfanView” with its scan plugin is another lightweight choice. For advanced control, “VueScan” offers a free version with core functionality. Most modern all-in-one printers also bundle free scanning software compatible with Windows 11.
Why I Chose “Scan Document to PDF”
My HP scanner software seemed pretty snoopy, not localized to my own PC. Not that I have anything dire to hide, but I’d rather not have my private affairs shooting off to a server who knows where. So I tried the built-in Windows “Scan” function for scanning documents on my trusty ink-jet printer/copier/scanner. It would run pages through the feeder, but then freeze up.
I’ve had mixed experiences with free software, often it gratuitously installs crap-ware on your PC. But surely not Microsoft… so I downloaded the free “Windows Fax and Scan” app mentioned by Claude. It did work, but was a bit clunky and limited. You have to first save a file in some graphic image format like PNG or JPEG, then go to Print, and choose “Microsoft Print to PDF”.
But then, I installed another free Microsoft app, “Scan Document to PDF”. That seems like a sweet spot here. It seamlessly scans to PDF, but has a good deal of extra functions that are intuitively accessible. It can save files as images like jpg if that is what you want. You can activate OCR to make a scanned document searchable. You can scan individual pages, and decide which ones to bundle into a pdf file. You can brighten or rotate pages, etc.
INSTRUCTIONS FOR “SCAN DOCUMENT TO PDF” ON WINDOWS 11 PC
( 1 ) Click Start icon, to left of Search bar at bottom of Windows screen. Click on Show All, for a list of all programs. Scroll down to Scan Document to PDF and click.
( 2 ) Check scan settings showing on left hand side. Can adjust them here, or by clicking Profiles button. Paper Source: Glass for one sheet on scanner, or Feeder for auto feeding pages. Resolution: Suggest 300 dpi. Bit Depth: Color for a color scan, or usually Grayscale for a black & white final document (sometimes gives better resolution than the “Black & White” setting).
( 3 ) Click Scan button (top left) to initiate scan. (Note: on the side of that button is a dropdown for options like setting up Batch Scans.)
( 4 ) Scanned pages will show on screen. To save them all as one PDF, click the Save PDF button. Default pdf file destination is /Downloads/ folder. (To save only selected pages into the final PDF, click on the dropdown on side of that button)
MORE OPTIONS
( 5 ) BEFORE SCANNING: (A) You can set up a different Profile of scan settings (scanner device, feeder, resolution, etc.) by clicking on Profiles button. (B) Click on OCR button to make final pdf searchable (not just a static image).
( 6 ) AFTER SCANNING: (A) Click Import to import pages from existing PDF, that you can then add to newly scanned pages. (B) Click Image button and select a page to crop, brighten, rotate, make black&white, etc.
I read Straw Dogs, a critique of modern society by English political philosopher John Gray, shortly after it was published in 2002. (No relation to the movie with the same name). Wikipedia summarizes the author’s view as, “Gray blames humanism, and its central view of humanity, for much of the destruction of the natural world, and sees technology as just a tool by which humans will continue destroying the planet and each other.” I cannot recommend the book as a whole – the reader is left in a state of despairing passivity. My AI justly notes, “Critiques of John Gray’s Straw Dogs: Thoughts on Humans and Other Animals generally center on its extreme pessimism, logical inconsistencies, and rhetorical excesses.”
All that said, the book did contain many interesting observations. One line of thought that struck me at the time was that, with increasing efficiencies in the production of basic goods and services, more and more human effort will go into simply entertaining or “distracting” each other:
The days when the economy was dominated by agriculture are long gone. Those of industry are nearly over. Economic life is no longer geared chiefly to production. To what then is it geared? To distraction. Contemporary capitalism is prodigiously productive, but the imperative that drives is not productivity. It is to keep boredom at bay. With wants so quickly sated, the economy soon comes to depend on the manufacture of ever more exotic needs.
I was reminded of that line of thought when, at a recent gathering of PhD chemical engineers, I heard that one of our number has become somewhat well-known for a late-career shift. She goes by the name Andrea Hulamyhoop these days. (I happen to know her real last name and approximate age, but she wishes to keep those private).
Her father was a chemical engineering professor, and she earned a PhD in the discipline at Princeton University. She was just going along living a fairly normal sort of life, with a regular job, when without warning, it happened:
Then one day, she saw a girl hula hooping. “She looked really free and happy, and I thought, interesting, maybe I’ll try it.” A few minutes at a time quickly became an obsession. Turns out, there are whole online communities of hula hoopers who share tips and support. Conferences. And many shows and events looking for a pro to dazzle and inspire audiences.
“The hula hoop has changed everything in my life,” she says. “I didn’t know I could become a fit, sporty person. I didn’t know I was one. I love performing, and I love people, and I love parties.
“I always thought my life was a bit OK. My kids were grown up. I was enjoying my job,” she says. “But you know, we kind of think, is this all there is? And then to realize there’s this whole world — it’s been incredible. I’m happier than I’ve ever been in my life.”
Andrea Hulamyhoop doesn’t just swirl a hoop around her waist. She can twirl multiple hoops around multiple body parts, with style. She is perhaps best known for her appearance on America’s Got Talent in 2025, where she smashed previous records by bending over and twirling a hoop around her rear end for just over an hour and fifteen minutes. The crowd went wild.
The physics of this feat seem almost impossible, but seeing is believing. Andrea gives a gracious tutorial here.
When I asked who is the most famous holder of a Princeton chemical engineering PhD, both ChatGPT and Claude insisted that former GE president Jack Welch is more well-known than Andrea the butt-hooper, but I doubt that is true below a certain audience age bracket. She has some 17,000 Instagram followers. I’d be willing to bet that in a crowd of under-40’s today, if you asked “Have you heard about the guy who was president of GE in the 1980’s and 90’s?” or “Have you heard about the gal who can twirl a hula hoop on her butt?”, Andrea Hulamyhoop would win.
All this brought back to my mind the notion that as a society we are able to afford to devote a great deal of time to sheer entertainment, rather than growing potatoes. A comment by a certain @petesounds9321 on Andrea’s epic 2025 AGT YouTube showed he had evidently not read Straw Dogs:
“I’d say we need more scientists than hula hoopers but hey…maybe I’m way off.”
This is a “guest” blog post that I asked Google Gemini Pro to write. Data centers are increasingly becoming a political issue in communities across America. People are asking questions like: “Why do we need these things? How much water will this use?” Because these are sometimes referred to as “AI Data Centers,” people might assume that data centers are primarily about creating cat memes and fake videos. And it’s true that’s a part of AI, and it’s true that much of the new data center construction is for AI.
But… data centers have been around for a while. People are only now taking notice of them, for the most part. To better understand this issue, I asked — what else? — AI to explain how much data centers are used in our daily lives. AI in this case means Google Gemini Pro.
I’ll paste the full guest post below, but I want to point something out first: this blog post makes no mention of AI. Instead, it talks about: GPS and mapping apps; almost everything you do if you work in an office; credit cards and digital banking; news and social media. All of these things rely on data centers and would cease to function without data centers. That’s not because I asked Gemini to leave out AI from the guest post — when I followed up on this omission, Gemini said “It was a calculated omission—partly to keep the focus on the immediate ‘analog’ shock to daily life.” Most people probably wouldn’t care of they lost the ability to create funny images with AI. They would care if they lost all of their photos, access to their Dropbox account, and the ability to send email.
You could interpret all of this as saying we are “too dependent” on data centers and the modern Internet. You could also say we are “too dependent” on electricity. Or modern plumbing. Or modern supply chains. Or agriculture. Modern life is based on modern technology. I don’t know if it really makes sense to say we are “dependent” on these things, other than that we use them and they are beneficial.
Anyway, on to the guest post from Google Gemini Pro:
The Day the Cloud Evaporated: Life After the Data Center Collapse
Imagine waking up tomorrow morning in your suburban home in Ohio, or your apartment in Seattle. You reach for your smartphone to silence the alarm, but the screen is a stubborn, glowing rectangle of error messages. You try to check the weather, but the app’s spinning wheel never stops. You try to text your partner, but the message stays “Sending…” until it eventually fails.
This isn’t just a bad Wi-Fi connection. Every data center on Earth—those massive, humming warehouses filled with silicon and cooling fans—has vanished. In an instant, the “brain” of the modern world has been lobotomized. For the average person in the United States, life wouldn’t just slow down; it would fundamentally reset to 1950, but without the physical infrastructure of 1950 to catch the fall.
I don’t like wasting time bending over and pulling out weeds, one by one. Much more efficient to go squirt squirt and eliminate lots of weeds at a time. But I realized in the past year that the Roundup I spritzed on the weeds in my mulch beds and sidewalk cracks just wasn’t killing them like it used to. The weeds would shrivel a bit, but then many would bounce right back. So, when I went to Home Depot to buy some more this week, I looked at the ingredients on the label. What?? Where is the glyphosate? For decades, “Roundup” was synonymous with glyphosate.
Glyphosate has several desirable properties as an herbicide. You spray it on the leaves, and it kills the plants right down to the roots. However, it has minimal residual toxicity in the soil, so it is unlikely to kill any plants you did not spray, and you can replant quickly in a soil patch that you had cleared with glyphosate. Farmers love it, because you can buy genetically engineered strains of crops like corn that are immune to glyphosate, so you can spray your fields to kill weeds without harming standing crops.
The glyphosate story is much bigger than homeowners bending over to pull weeds. The chemical has become indispensable for current agriculture. Global glyphosate sales are about $10 billion per year, and its impact on crop productivity is enormous. A 2017 study (apparently not paid for by Monsanto) predicted dire effects of discontinuance:
World prices of all grains, oilseeds and sugar are expected to rise, especially soybeans (+5.4%) and rapeseed (+2%). The welfare impacts are mostly negative, with global welfare falling by $7,408 million per year. Land use changes will arise, with an additional cropping area of 762,000 ha, of which 53% derives from new land brought into cropping agriculture, including 167,000 of deforestation. These land use changes are likely to induce the generation of an additional 234,000 million kg of carbon dioxide emissions.
What’s not to like about glyphosate? Well, maybe it causes cancers in humans. This is a contested claim, and I don’t have the expertise to penetrate the arguments. Because glyphosate makers like Monsanto and its successors Bayer have deep pockets, lawyers on contingency have swarmed like killer bees to file lawsuits, over 100,000 of them, of which about 60,000 remain active globally.
National security issues have muddied the waters here. For instance, Robert F. Kennedy, Jr. led a landmark legal case against Monsanto in 2018, securing a $289 million jury verdict (later reduced on appeal to $20.4 million) for a school groundskeeper who developed non-Hodgkin’s lymphoma after prolonged exposure to Roundup. That case energized a bazillion further lawsuits. But now Kennedy is going along with the current administration’s position that it is strategically necessary to maintain production and responsible access to glyphosate: farmers demand it, and Bayer operates the only plant in the U.S. producing significant amounts of elemental phosphorus, which is a vital material for defense and, increasingly, for lithium batteries.
Naturally, Bayer denies that glyphosate is particularly harmful. The firm continues to sell the product to farmers and landscape professionals, but it has removed it from retail bottles of Roundup you see on Home Depot shelves, in an effort to reduce exposure for further litigation.
What have they substituted for good old glyphosate? I found a brew of three other chemicals. I can report reliably that this mixture is much less effective, especially on grasses and on well-established weeds. The Internet backs up my observations. The Iowa State garden extension has a great table of the real-world effects of all common herbicides.
So, what to do? For grasses in my backyard gravel patch, I am spraying multiple times. If that doesn’t work, I may try covering that area with a black tarp for a month to kill the grass. I have considered buying a propane flamethrower weeder, but that seems only effective on the same things the current wimpy Roundup kills (small/young broadleaf weeds).
For mulched areas, I am incentivized to keep up with fresh mulch to keep weeds from growing in the first place. For larger weeds, I have now found myself bending down low, grasping them close to the ground, and actually pulling them out by hand.
If you listen to or read major economists discussing what they think are big-picture problems, then their list usually includes three topics: Fertility, Culture, & the Fiscal Health. On the wonkier side, you’ll also hear that housing scarcity and affordability is a problem, but let’s stick with the first three.
Fertility
People are deciding to have fewer children for a variety of reasons. In no particular order, the reasons include greater access to financial institutions, more popular female education, higher female wages, lower infant mortality, and falling religiosity. Some also speculate that housing affordability, safety regulations, and social safety nets contribute too.
What’s wrong with lower fertility? In an objective sense, there is nothing wrong. But, in the sense that people value similar things, we are in somewhat uncharted territory. Realized fertility is dropping across the globe. We know that economies of scale increase productivity and real wages. We also know that technological innovation comes from having more minds engaged with economic problems. It’s possible that labor productivity rises faster than the productivity that we lose with smaller scale, but it’s an open question. What happens to the liberal societies and polities when the liberals fail to persist? These are big geopolitical concerns.
Culture
People seem to be more fragmented religiously and culturally. Social scientists used to discuss Judeo-Christian norms more often. Sometimes you’d hear about English or Roman legal tradition or enlightenment values. But now, there seems to be very little in terms of common social cohesion. In the USA, the general common culture seems to be ‘smile and be nice’. That’s not the worst common rule, but it’s not enough to hang our hat on for a capable liberal state.
The lack of cultural cohesion isn’t my own particular concern – public intellectuals in economics and elsewhere feel like there is a problem. There is a mix of reasoning behind the concern. Some people are worried about transmitting values to the next generation, some are worried about how people behave when no one’s watching, and still others are worried about simply lacking a Schelling point that coordinates large scale economic cooperation.
Nearly every interior wall and ceiling in every home in America is covered with sheetrock = drywall = gypsum board. Sheetrock (a brand name for drywall) consists of an interior layer of rigid gypsum (a mineral composed of calcium sulfate dihydrate) plus some additives, with outside layers of strong paper or fiberglass. It normally comes in 4 ft x 8 ft sheets.
Normal houses have a framework of mainly 2×4 or larger wood lumber. Each wall has vertical 2×4 studs, spaced every 16”. Sheetrock is trimmed to size, and nailed or (these days) screwed into the studs.
That is the theory, anyway.
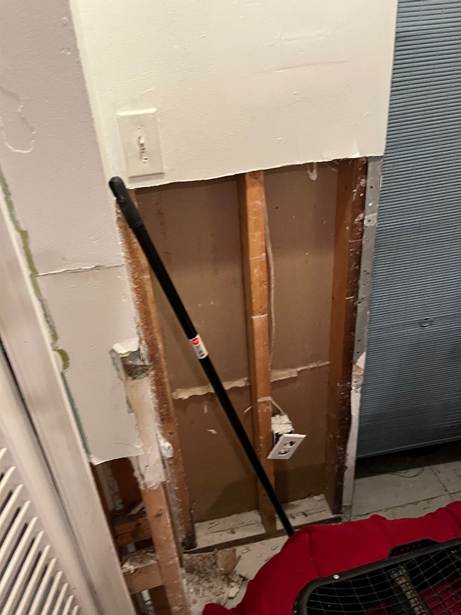
I have never done this stuff at large scale before, other than clumsily patching occasional small dings in a wall. A little while ago, I got to experience the process, hands-on. I was part of a team that helped someone whose basement had flooded. We cut out the lower ~4 ft of drywall, and replaced it with fresh drywall.
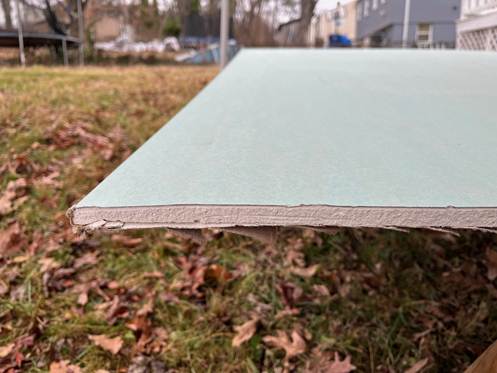
First, how to you cut drywall? A long, straight cut is accomplished by drawing a straight line and cutting along it, all the way through one layer of the facing paper. Then you hang the drywall sheet on the edge of a table, and crack the interior gypsum layer. Then you cut the other side of the paper. The end result of such a cut is like this:
Typically, you install drywall on the ceiling first. Then the top 4 ft of the walls, then the bottom 4 ft of the walls. You butt the pieces close to each other. For the lowest piece of drywall, you insert a curved metal wedge under it, and step on the wedge with your foot to lift that drywall piece to butt its top edge up against the upper piece. If you look carefully near the middle of the following photo, you can see the red wedge I used to jack up that small lower piece of drywall. It’s OK to leave a gap between the floor and the lower edge of the bottom drywall, since that gap will be covered by baseboard.
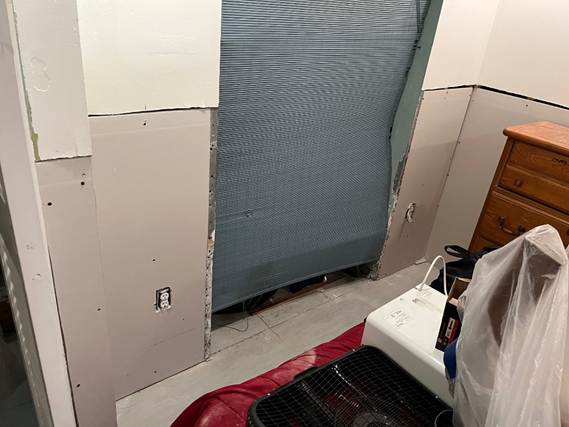
This was in a bathroom. I cut the lower green pieces with a little hand power saw, and screwed them into the studs, using the green and black driver visible on the stand in the left foreground.
The next two photos are before and after of a bedroom wall, again showing the bottom course of sheetrock we installed.
Filling in Cracks and Holes
As you can see, at this stage, there are like ¼” cracks between the installed sheets of sheetrock, and the mounting screw holes are visible. These imperfections are filled in with goo called joint compound, or “mud.” The mud is applied with a “knife” like this:
Cracks are covered with paper or fiberglass tape, with mud smeared over the tape. Typically, three layers of mud are needed to achieve perfect, smooth coverage. Each layer must dry hard before applying the next layer. Each layer may be sanded lightly as needed.
A key technique is to tilt the knife so the mud is maybe 1/16” thick over the tape or over a screw, but taper the mud to zero thickness on the wall away from the tape or screw. This feathering is essential; if your mud layer ends with appreciable thickness instead of feathering, you have to do a lot of sanding to get a smooth blending into the plain drywall at that edge. Pro tip: carefully stir more water into the joint compound as needed to keep it wet and flowing, especially for overnight storage. This video from Vancouver Carpenter displays mudding technique.
That is mainly it. For perspective and confidence building, it is helpful to work with an expert, as I was able to do.
If you’ve been on LinkedIn recently, then you may have seen the chatter about teaching your artificial intelligence to have various skills. I saw one post by a guy who claimed to have created several skills, each representing a tech billionaire.
At first, I thought “I am behind the 8-ball. What is this new thing?”. Obviously I know what the word “skill” is and how people use it, but I had not encountered its use in the context of AI having it. What does it mean for an AI to have a skill? I somewhat dreaded the the work of learning the new skill of teaching my AI skills.
Then I had lunch with a computer scientist and I learned that skills are nothing new.