The Cost of Thriving Index from Oren Cass’s American Compass is an attempt to calculate how well US families are doing financially, but without using traditional inflation adjustments to income. Instead, Cass and crew have chosen 5 categories of goods and services, and tracked those over time relative to median earnings for men ages 25 and older (in the baseline model — it can also be applied to different categories of workers).
Scott Winship and I wrote a detailed critique of the COTI, which I summarized in a previous blog post. Our critique comes from several angles, including correcting several major errors in COTI, as well as arguing that standard inflation adjustments to median income are superior to this new approach.
Based on our critique, I don’t think COTI is a very good measure of how well US families are doing financially. But the COT Index still has many fans. And Cass seems to think Trump is in large part pursuing many policies that should help out US workers and families, such as Trump’s tariff policies. Thus, it will be useful to see if Trump’s policies are leading to American workers “thriving” in the first year of Trump’s presidency.
Unfortunately, even using Cass’s preferred approach, Americans don’t appear to be thriving under Trump.
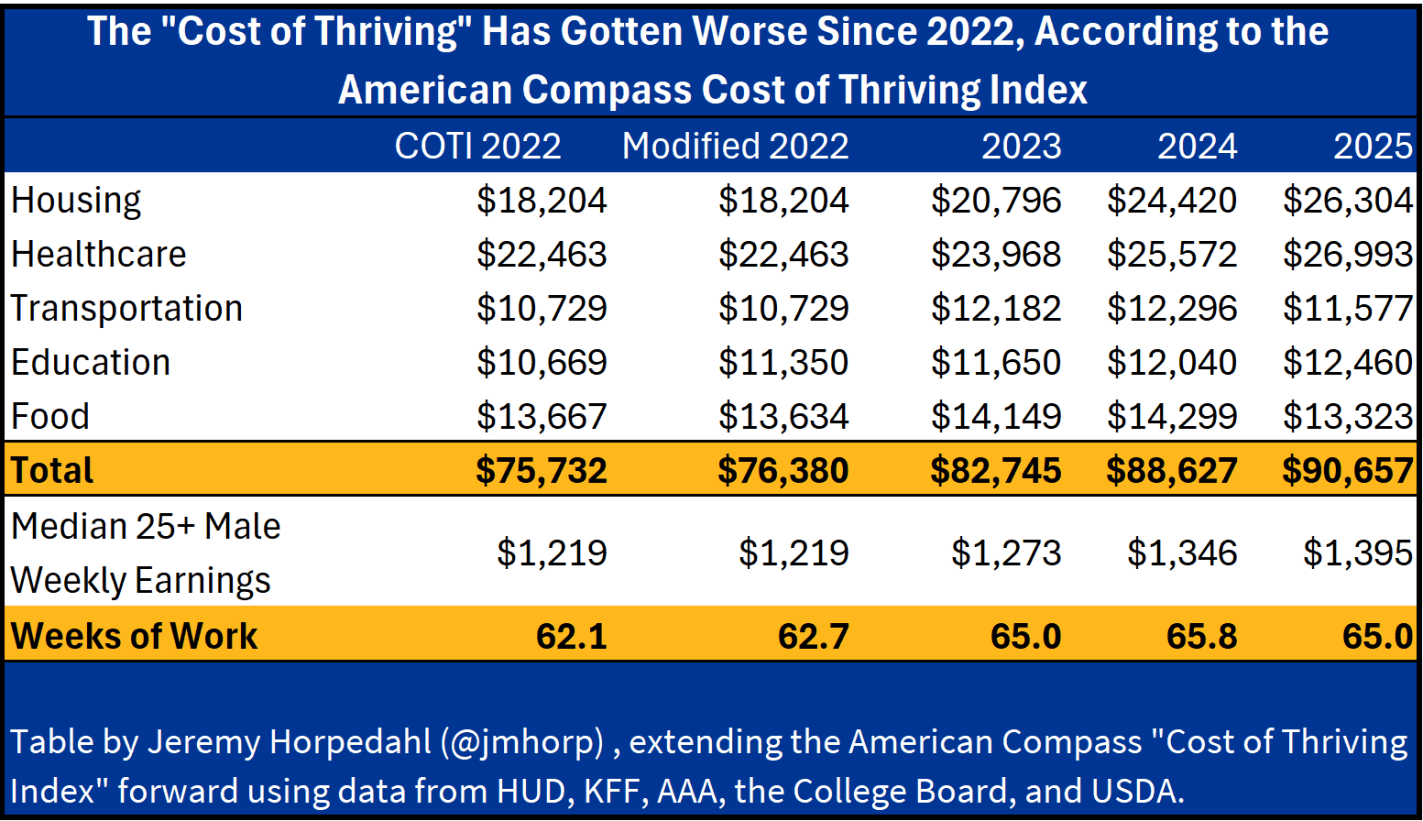
As seen in the table above, it took 65 weeks of work for a median male to “thrive” in 2025 according to COTI, an impossibility since there are only 52 weeks in the year. The historical context is that the Index claims this number was much lower in 1985, right at 40 weeks of work, and has steadily increased over time (though it did fall slightly from 2013 to 2022). You might say that, hey, at least 2025 is a little better than 2024, but both numbers are worse than 2022, and indeed are the highest in the history of this Index. Maybe Trump just needs more time to help Americans thrive? I will, of course, update this data as more becomes available, but right now thriving isn’t looking so good, according to this Index.
A few notes: I had to modify the 2022 figures slightly in order to update the data to the present day. The only really big change here is to Education, which Cass even acknowledges in his 2022 version of the Index that he is using 2021 data because 2022 wasn’t available yet. Instead of Department of Education data, I swap in the College Board data for nominal list prices and otherwise use the same approach as Cass (I think this is flawed approach, as I explain in my paper with Winship, and net tuition and fees is a better measure, but I’m just trying to replicate the Index here). This doesn’t change the Education cost much, but it does make the current year available sooner. There are a few minor changes to Food and Housing, because the relevant agencies report them slightly differently now, but largely they are the same.
So is the median male worker really worse off today than in 2022? No. As Winship and I argue, using standard inflation adjustments is superior to Cass’s approach. Here’s what the same earnings data looks like if we just adjust in for inflation (here using the standard CPI, which probably overstates inflation):
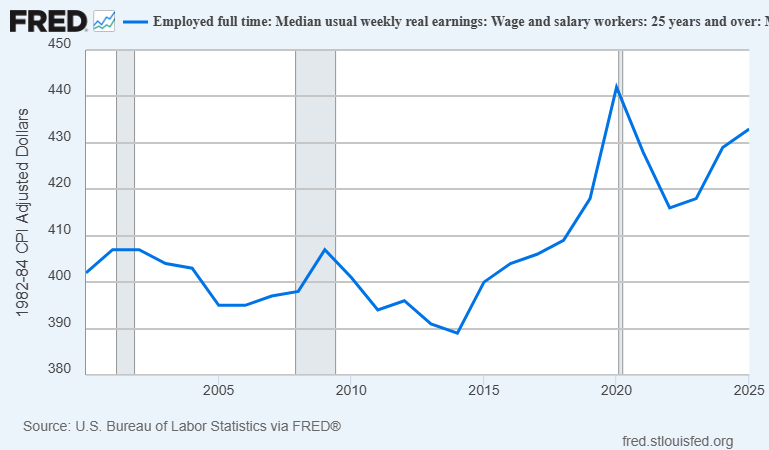
Notice that the 2025 earnings data for men ages 25 and older is higher than both 2022 and the pre-pandemic years (2020 is artificially higher because lower earning men disproportionately dropped out of the labor force that year). You might say: well, not by much! And it’s true, by this measure 2025 is only about 4 percent higher than either 2019 or 2022. Still, this data paints a very different picture than the Cost of Thriving Index: rising real earnings, rather than less thriving. American workers are thriving under Trump, according to this data, just as they were thriving before Trump.
