During president Trump’s first term in office, he made a bunch of waves (as he’s wont to do). His more educated supporters said that he engaged in substantial deregulation of telecommunications, which got a lot of press. There was a quiet contingent of educated voters who were relatively silently supportive on Trump’s regulatory policy, even if his character was indefensible or his other policy was less desirable.
But was Trump a great deregulator? Or was it one of those cases when we say that he regulated *less* than his fellow executives? The George Washington University Regulatory Studies Center can help shed some light with their data. Specifically, they have calculated the number of ‘economically significant’ regulations passed during each month of each president going back through Ronald Reagan’s term. What counts as ‘economically significant’? The definition has changed over time. But, generally, ‘economically significant’ regulations:
- “Have an annual [adverse] effect on the economy of $100 million or more
- Or, adversely affect in a material way the economy, a sector of the economy, productivity, competition, jobs, the environment, public health or safety, or State, local, or tribal governments or communities.”
The only exception to this is between April 6, 2023 and January 20, 2025 when the threshold was raised to $200 million.
The Data
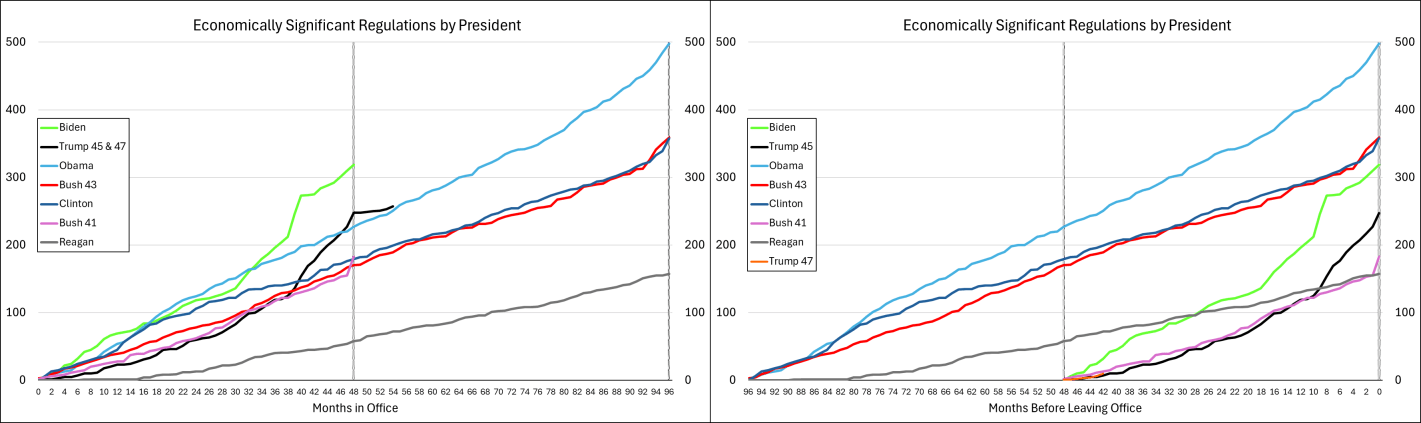
The graph below-left shows the number of economically significant regulations for each president since the start of his term, through July of 2025. It’s reproduced from the link above except that I appended Trump’s second term onto his first term. What does the graph tell us? There doesn’t seem to be much of a difference between republicans and democrats. Rather, it seems that, generally, the number of economically significant regulations increases over time. Importantly, the below lines are cumulative by president. So each year’s regulations each cost $100m annually and that’s on top of the existing ones already in place. So, regulatory costs generally rise, with the caveat that we don’t see the relief provided by small or rescinded regulations (for that matter, we don’t see small regulatory burdens here either). Something else that the below graph tells us is that presidents tend to accelerate their economically significant regulations prior to leaving office. Reagan was the only exception to this pattern and he *slowed* the number of regulations as the end of his term approached.
Below-right is the same data, but the x-axis is months until leaving office. Every president since Bush-41 has accelerated their burdensome regulations during their final months in office. The timing of the acceleration corresponds to how close the preceding election was and whether the incumbent president lost. Whereas all presidents regulate more in their last 2-3 months in office, the presidents who were less likely to win re-election started regulating more starting around eight months prior to leaving office. Of course, they wouldn’t say that they expected to lose, but they sure regulated like there was no tomorrow.
What about Trump? Trump’s fewer regulations is caused by his single term. He definitely still added to the regulatory burden (among economically significant regulations, anyway). While Trump started with the fewest additional regulations since Reagan, and Biden started with the most ever initial regulations, together they earn the top prizes for most regulations added in their first term.
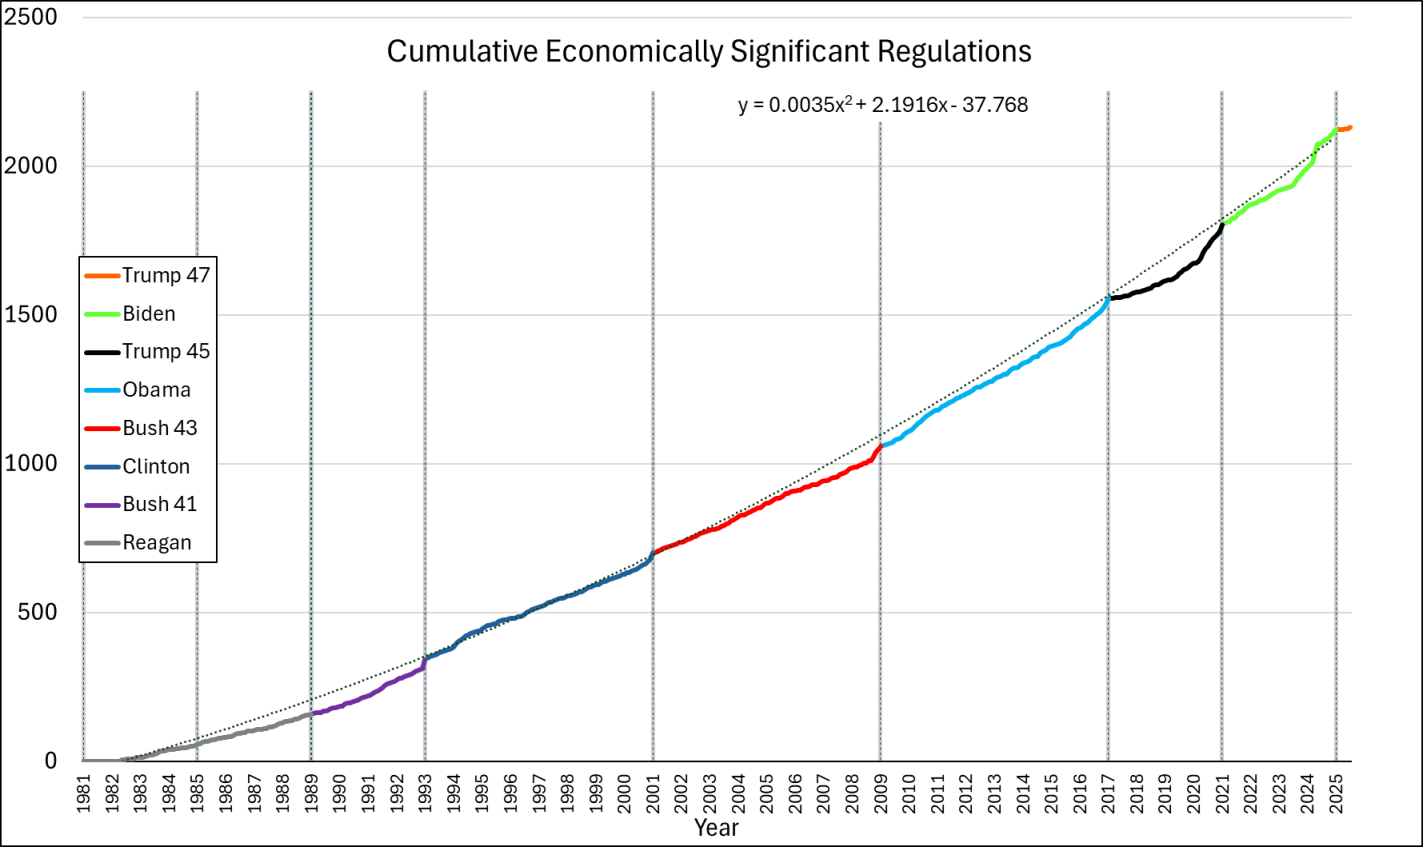
What if we append these regulations from end-to-end? That’s what the below chart does. We do have to be careful because the series is a measure of gross economically significant regulations and not net economically significant regulations. So, it’s possible that some rescissions dampened the below values, but this is the data that I have for the moment. While each presidential administrations increases regulation more than the prior, the good news is that the rate of change is not exponential. The line of best fit is quadratic. We’re experiencing growing regulations, but at least it’s not compound growth.
The Cost
We can estimate the costs of these economically significant regulations. It’s a rough cut, and definitely a lower bound since rescission is rare and $100 million is itself a lower bound, but we can multiply the number of regulations by $100m to get minimum annual cost. Like I said, the Biden criterion from April 2023 through January 20, 2025 changed, so those regulations get counted as $200 million instead. The change in definition means that the regulation counts underestimate the late-term Biden regulations relative to the other presidencies.
Continue reading


