Congressional districts must be redrawn after each US Census. In fact, that is one of the main functions the Census: to determine how many seats of the US House of Representatives that each state is allotted. A related function is to give states information about the distribution of the population in their state. Even if a state doesn’t gain or lose seats after a Census, the population in their state may have grown, shrank, or simply moved around within the state. If each Congressional district is to represent roughly the same number of people, district boundaries will still need to be redrawn even absent a change in the state’s total share of the US House seats.
That much is clear. However, given that historically and still largely today Congressional districts are drawn by state legislatures, there is a temptation and a real possibility that the party in power of a state legislature will draw boundaries in a way that benefits that party. There is nothing illegal about doing this as far as the federal Constitution is concerned (that I am aware of), but it does seem a bit unsporting. But I guess much of politics might be deemed “unsporting.”
Nonetheless, sometimes the shape of districts is so obviously weird and not representing an cohesive group of citizens or communities that it gets the derisive term “Gerrymander,” which derives from a historical example of a very odd looking district. But even if a district doesn’t look weird, it may still give one party an advantage that some deem unfair, such as by diluting one party’s supporters into multiple districts so they get no seats, or alternatively cramming all the supporters into one district so they have a very lopsided victory in just one district, rather than controlling multiple districts. This practice is known as “partisan Gerrymandering,” and it will be my focus in this post today (there are other forms, such as racial Gerrymandering, which are also important but are beyond the scope of this post).
Surely this practice occurs. Some states have tried to avoid it the problem of Gerrymandering by using non-partisan commissions, though this is a minority of states (less than a dozen), and when push-comes-to-shove they don’t actually seem that committed to the idea (both California and Virginia have essentially abandoned these commissions in 2025-26 to attempt to, once again, gain a partisan advantage). But lately a particular question has come up: does partisan Gerrymandering benefit one major party more?
In total for the US House, whatever Gerrymandering at the state level that is happening seems to roughly wash out in national representation: in the 2024 election, Republicans received about 51.7% of the two-party share of votes totaled over all House elections, and Republicans have about 50.6% of the seats in the House. Perhaps you could say that the GOP effectively loses 5 seats to what they “should” have in a truly proportional sense, but this ignores many factors, some of which I will discuss below. But even so, the GOP has a slim majority in the House and they won a slim total of national House votes. It’s about right.
But that “washing out” at the national level ignores some very large disparities at the state level. In some states, one party has all the House seats, even though they got nowhere near 100% of the House vote. Many of these are states with 1 or 2 House seats, which are less interesting because either there is no possibility of Gerrymandering (1 seat) or there is no obviously “fair” division, but it is not only those small states. For examples, Massachusetts gives all 9 seats to the Democrats, even though Republicans received 31.5% of the two-party vote share. Do Republicans deserve 3 of the seats? Is the fact that they don’t have 1/3 of the seats evidence of Gerrymandering? Conversely, in Oklahoma Republicans hold all 5 seats, even though Democrats got 30% of the vote. Should Democrats get a seat or two in Oklahoma?
(Note: for all vote data, I have queried Google Gemini Pro. I found multiple errors along the way, but I am fairly confident the numbers are all correct now. Please let me know if you spot any errors).
Neither Massachusetts nor Oklahoma’s Congressional representation is an obvious case of Gerrymandering on its face. It’s possible that 1/3 opposition party support in both states is perfectly even distributed across the state, such that it would not be possible to draw any “fair” districts that give the opposition roughly 1/3 of the seats. But it could be the result of Gerrymandering, or at least an indication we should look deeper. We can tally up all of the differences across states in the following chart:
Chart 1
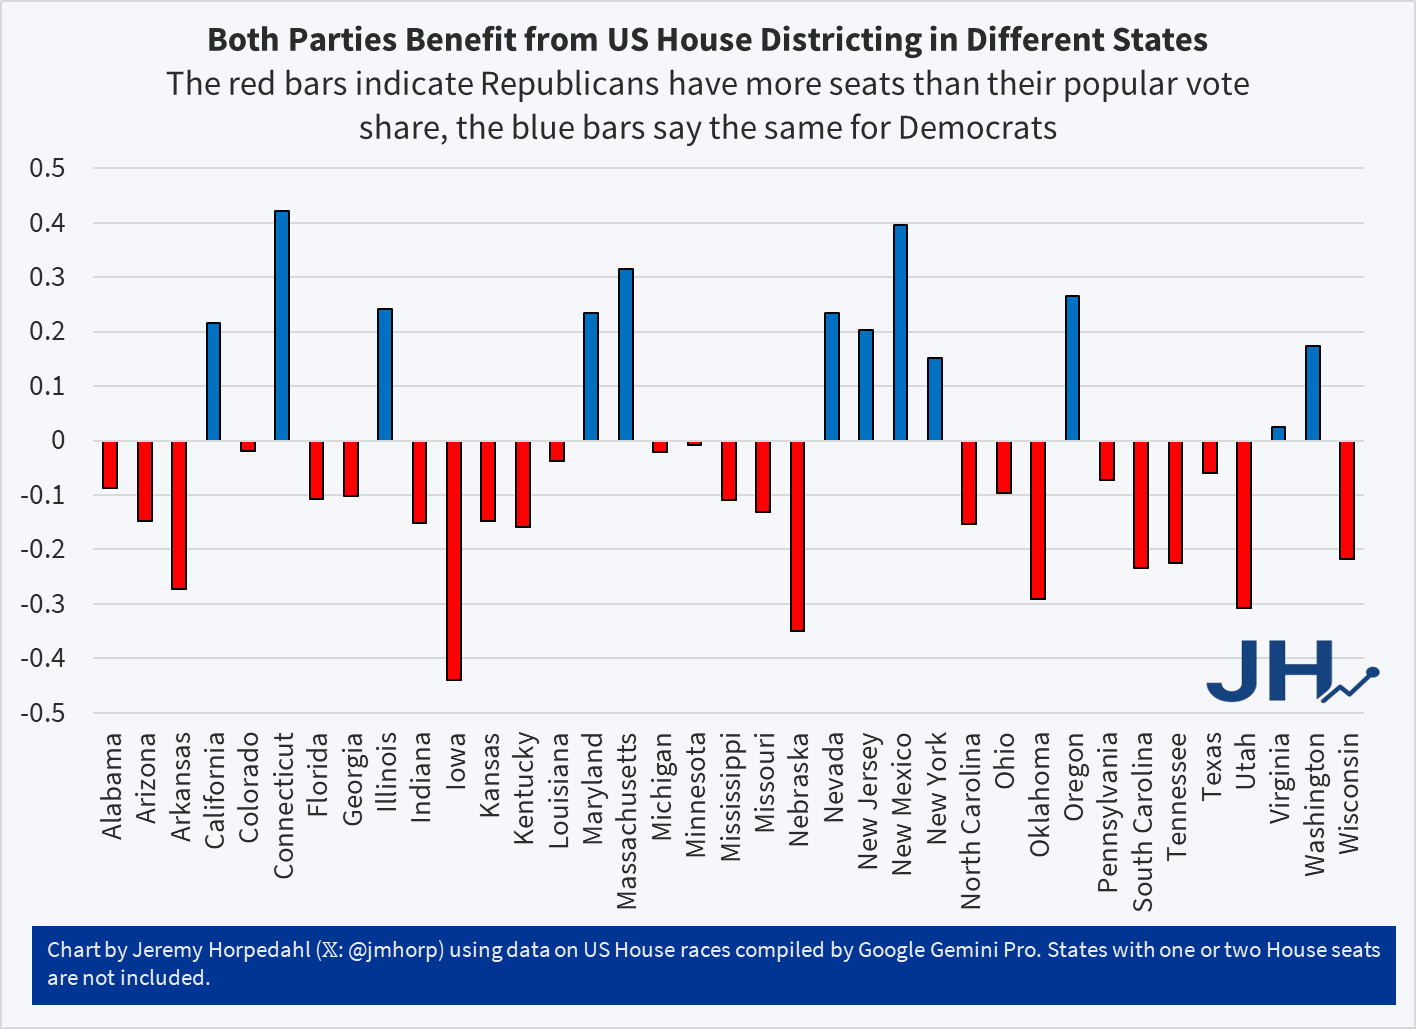
One thing you will notice in Chart 1 is that no state is “perfect” in terms of proportionately giving the number of seats based on the state House popular vote, though mathematically this would be highly unlikely given the small number seats in many states. Some states such as Colorado, Louisiana, Michigan, Minnesota, and Virginia come about as close as we might expect (two of these states have non-partisan redistricting commissions, two do not, and one has a partially partisan commission). Some states have very large differences, such as Connecticut and New Mexico for Democrats, and Iowa and Nebraska for Republicans. Again, this is not necessarily evidence of partisan Gerrymandering, it’s just an indication we might want to look deeper. And while there are more red Republican bars than blue Democrat bars, many of the red bars are quite small, and the unweighted average roughly washes out (it’s about -2% in favor of Republicans).
But there is a slight problem with the chart above. It includes several dozen uncontested House races, in which one party got 100% of the two-party vote share. This could arise either because the seat was uncontested, there was only a third party opposition, or because the state’s primary system allows for two candidates of the same party to be in the general election. If we exclude those uncontested races, which will highly skew the results, our overall totals look pretty similar: the GOP has 52% of the popular vote in contested races, and 51% of the contested seats. Of course uncontested seats could themselves be the result of partisan Gerrymandering, but even so it is probably best to exclude them from the chart above.
Alabama is an instructive case. While 5 of the 7 seats went to Republicans, three of these seats were uncontested by Democrats in 2024. If we look only at the 4 contested races, each party won two of the seats, and the popular vote share from these four races was extremely close: 51% Republican, 49% Democrat. That one percent difference is much smaller than the apparent gap of 9 points in the Republicans’ favor in Chart 1, since it was including three races where Republicans received 100% of the two-party vote.
Throwing out those uncontested races (as well as states with only 1 or 2 seats), we get the following modified chart:
Chart 2
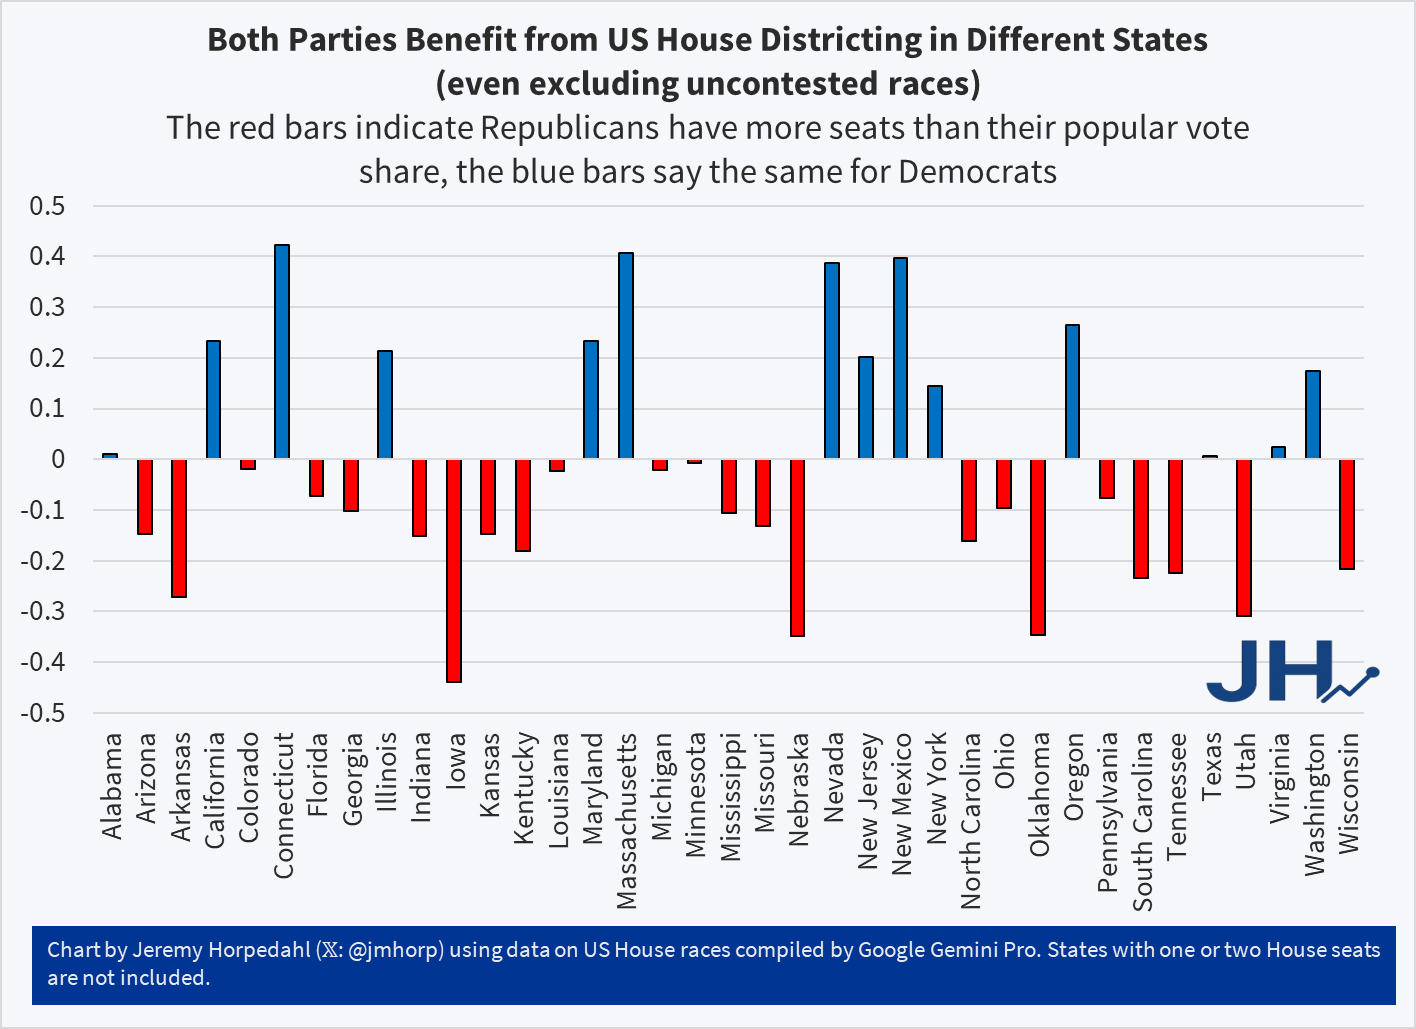
Removing uncontested elections in Chart 2 does remove some of the large bars, but many still remain. While Alabama and Texas shrink to having almost perfectly evenly distributed seats (at least for their contested elections), most states are unchanged. The unweighted average gap is still 2 points in favor of Republicans, but this seems like a reasonable amount given the mathematics of division for states with a small number of seats.
Partisan Gerrymandering almost certainly occurs in the US, and it might be a good idea to limit it in some way. Some voters in some states are probably not being represented accurately by their Congressional representative. But in terms of the balance of power in the House, I don’t think it actually makes much of a difference, at least not after the 2024 election (the first election after most states did their 2020 redistricting).
