I was listening to an episode of The Deduction, a podcast by the Tax Foundation. As if that first sentence isn’t evident enough, I was reminded of how confusing taxes are – period. Even experts disagree and see grey areas. As I was listening, I thought “man, they need a graph”. So, here we are.
Income Tax Vocabulary
The money that you are paid by your employer is your gross income. Not all of it is taxable. You can deduct money from your gross income to get your taxable income. Most people subtract the ‘standard deduction’ from their gross income, which is how I’ll proceed in this post. Since the standard deduction for 2026 is $16,100 for a single earner, that means that your taxable income is $16,100 less than your gross income. By following a formula, one can calculate the amount of money that they must pay the government. These payments can be all at once, throughout the year, or even directly from your paycheck. The total that’s due to the government by April 15 is called the total tax liability. Finally, the money that the government doesn’t take, and that you get to keep, is called your net income. It’s your income net of taxes.
If you’ve had a job, then you are probably most familiar with your gross income, what your employer pays you, and your net income, what you get to take home. The steps in between might include some hand-waving.
Marginal Tax Rates
One of the most confusing pieces of the income tax code is marginal income taxes. Below are the brackets for 2026.
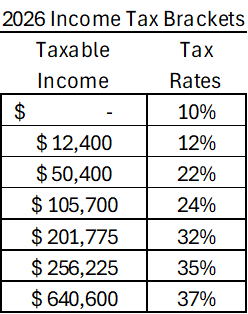
Marginal Tax rates work like this: Every dollar that you earn faces a tax rate. If your taxable income would be below zero, then you pay zero in taxes. But if your taxable income is $5k, then it gets taxed at a rate of 10%. That part should be pretty straightforward. But what if your taxable income is $15k? According to the table, you face a tax rate of 10% for dollars earned up to $12,400. That would be a tax liability of $1,240. But the remainder of your $15k in taxable income exists in the next tax bracket. That portion of your taxable income faces a tax rate of 12%. Sticking with the example, $2,600 is in the 12% tax bracket, so the tax liability for that portion of your taxable income is $312 (=$2.6k*0.12). Therefore, your total tax liability would be the sum of your tax liabilities across all applicable tax brackets: $1,552 (=$1,240+$312).
There are some features of marginal tax rates that are worth mentioning. Since the tax rates on the lower taxable income brackets don’t change, earning more gross income never reduces your net income unless the tax rate exceeds 100% (which it doesn’t here). So, when someone says that their taxable income is in the 35% tax rate bracket, they probably just mean that their last dollar earned is there. They’re only paying 35% on the taxable income that’s above $256,225. They’re not paying 35% of all earned dollars to the Internal Revenue Service (IRS).
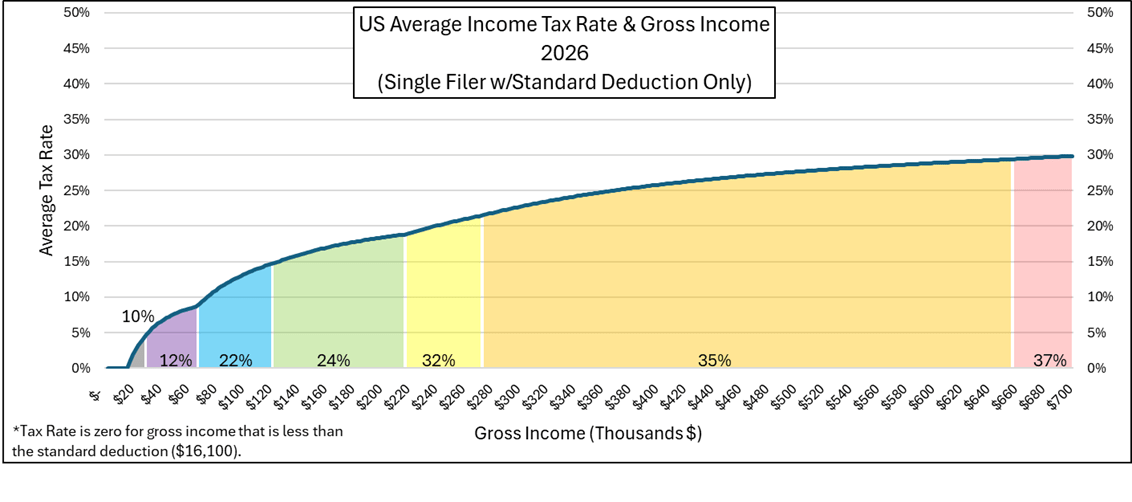
Below is a graph that details the different marginal tax rates with shaded areas. The blue line is the average tax rate. It’s calculated by dividing the tax liability by the gross income. Even though one might earn an income that’s greater than $257k where the marginal tax rate is 35% or greater, the average tax rate remains lower, topping out at about 30% in this figure. The average tax rate is lower than an earner’s top marginal tax rate because the income in those lower brackets never disappears or get taxed at a higher rate.
How does the government know in which tax bracket you belong? Your employer sends the IRS your income information. But, if you’ve completed a form W4, then you know that you can send the IRS payments directly from your paycheck throughout the year. How does anyone know how much you’ll earn by the end of the year?
They don’t. It’s a guess. That’s why the paycheck withholding is merely an “estimate”. You may overpay or underpay throughout the year, and you won’t know until you calculate your tax liability between January and April of the following year.
Net Income
Below is a graph that illustrates your net income given some gross income. Obviously, your net income is lower than your gross income, except when you earn less than the standard deduction. Also, note that the blue line is always increasing with a positive slope. That means: For each additional dollar of gross income that you earn, your after-tax net income also rises. There is no version of the world in which you take home less after earning more.

Taxes & Work
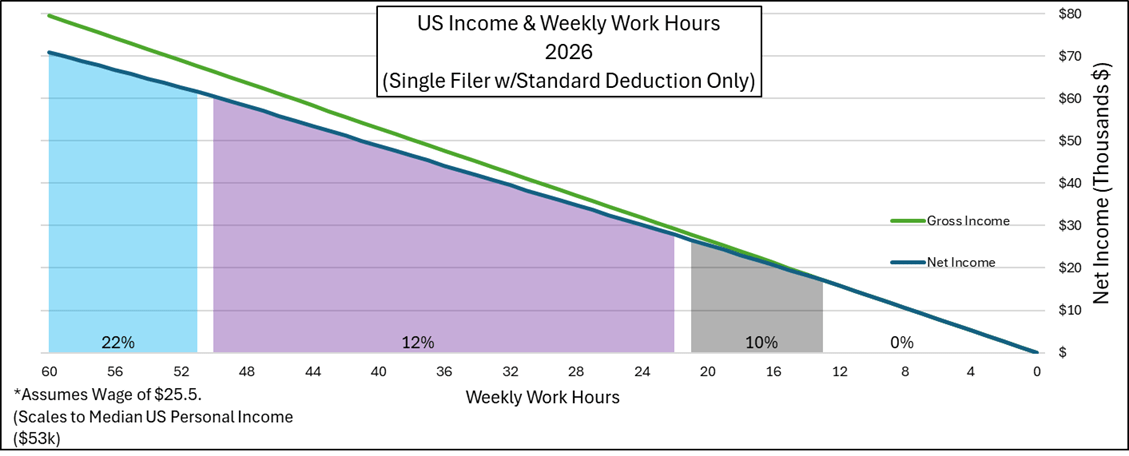
The 2025 US median personal income was about $53k. If one works 40 hours per week for 52 weeks, then that works out to an hourly wage of about $25.50. We can figure out our gross income, tax liability, average tax rate, and net income all from just the number of hours worked per week. The green line below plots gross income and the blue line is net income. Notice that, while the green line is straight, the blue line has a small kink at the rightmost border of each tax bracket. That’s where one begins to pay a higher tax rate on additional income. As one works more and more hours per week, gross income and taxable income rise. The gap between them also grows and does so at an increasing rate as one finds themself in higher tax brackets (I only plot up to the 22% tax bracket so that we can see everything). The blue line gets flatter as gross income rises. For every $1 increase in gross income, the net income only grows by $0.78 within the blue shaded area.
I can go on and on about taxes. I’ll stop here. There’s plenty more to say, and I’ve just examined what amounts to a very basic tax return. But hopefully, I’ve helped clarify US income tax brackets and marginal tax rates somewhat.

You’ve summarized well something that took me about 3 years to figure out once I entered the workforce!
LikeLike