The financial crisis recession that started in late 2007 was very different from the 2020 pandemic recession. Even now, 15 years later, we don’t all agree on the causes of the 2007 recession. Maybe it was due to the housing crisis, maybe due to the policy of allowing NGDP to fall, or maybe due to financial contagion. I watched Vernon Smith give a lecture in 2012 in which he explained that it was a housing crisis. Scott Sumner believes that a housing sectoral decline would have occurred, and that the economy-wide deep recession and subsequent slow recovery was caused by poor monetary policy.
Everyone agrees, however, that the 2007 recession was fundamentally different from the 2020 recession. The latter, many believe, reflected a supply shock or a technology shock. Performing social activities, including work, in close proximity to others became much less safe. As a result, we traded off productivity for safety.
The policy responses to each of the two were also different. In 2020, monetary policy was far more targeted in its interventions and the fiscal stimulus was much bigger. I’ll save the policy response differences for another post. In this post, I want to display a few graphs that broadly reflect the speed and magnitude of the recoveries. Because the recessions had different causes, I use broad measures that are applicable to both.
To help visualize the differences, I take a note from Ed Leamer, who wrote “Macroeconomic Patterns & Stories” (You should read it. It’s good.). Below is a graph of RGDP relative to it’s value at the peak of economic activity prior to the recession. Rather than define recessions differently by indicator, I use the NBER identification of recessions and define the peak as the period before the recession. So, the business cycle peak period is not necessarily the high point for each indicator.
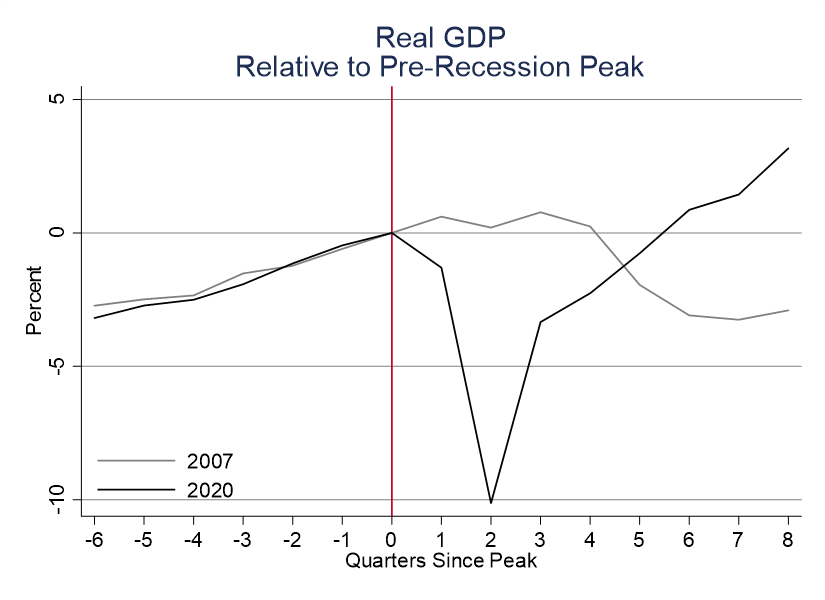
First, most broadly, RGDP measures the production of all final goods and services. This is the broadest measure of economic output. In the 2020 recession, the decline lasted only two quarters, and we returned to the peak value within 18 months. The 2007 recession is different in that RGDP first plateaued and then fell for an additional four quarters. Two years after the peak, RGDP was still down 2.9%. Contrast that with the 2020 recession in which two-year-out RGDP was up 3.2% from the peak. The most recent recession had a much bigger and briefer decline in economic output. But the recovery was also much quicker.
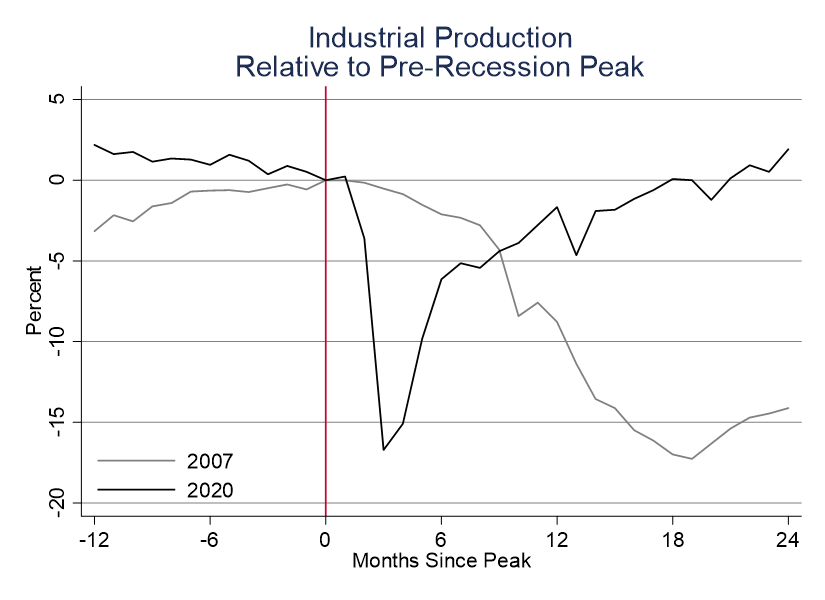
Industrial production, which measures mining, utilities, and manufacturing, tells an almost identical story. The 2020 recession saw a quick and deep decline, rapid recovery, and we’ve surpassed the pre-recession peak. The 2007 recession saw a plateau, a prolonged decline, and a slow recovery. Two years after the 2007 peak, industrial production was still down 14%. Two years after the 2020 peak, industrial production was up 1.9% from peak.
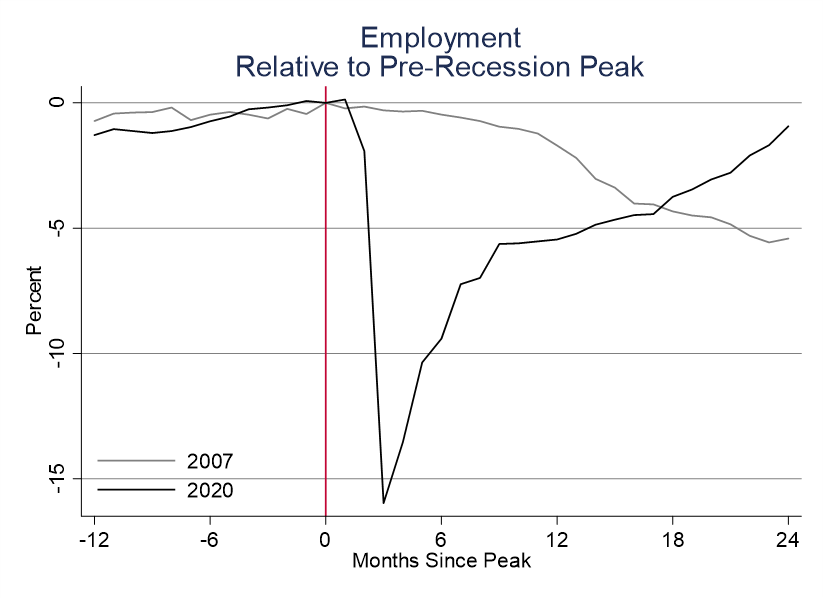
Employment tells a similar, though less dramatic story. The 2007 recession employment follows the same pattern as output. But the 2020 recession reflects that the recovery, while regaining a lot of lost ground quickly, has still not reach its pre-recession peak. Theories abound as to why. Maybe women aren’t re-entering the labor force after taking time to care for children. Maybe seniors took the decline as an opportunity to retire. Maybe the technology shock has had persistent effects. After all, we’re still talking about covid-19 and older people are still relatively susceptible to more severe symptoms.
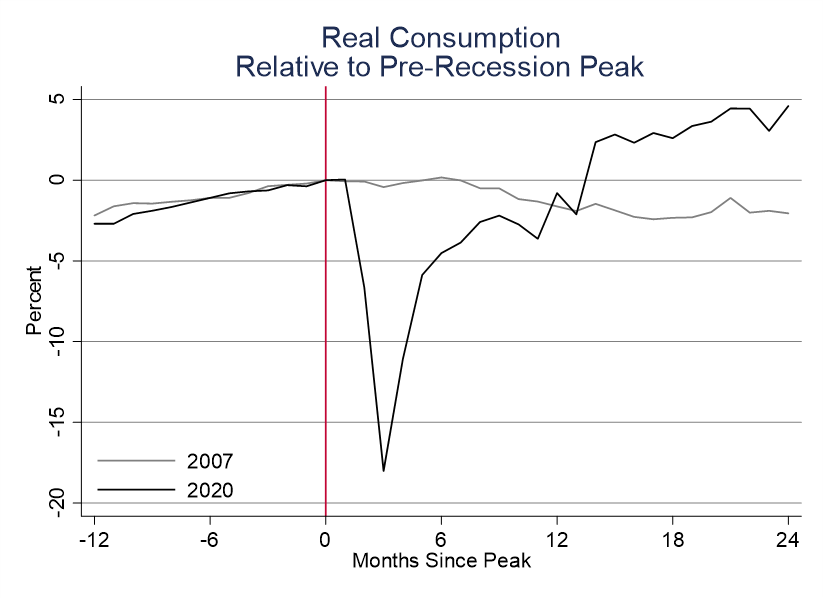
One of the ways in which the two recessions were substantially different was the change in consumption patterns. Real consumption had surpassed its 2020 pre-recession peak 14 months later – and then continued to grow along its original growth path. So, not only did consumption recover quickly – it looks like nothing changed at all in the aggregate. For the 2007 recession? We don’t see any signs of real consumption recovery until after 2 years from the peak.
But what about the disaggregated data? If you thought that the consumption data was exciting, check out the below graph of real consumption of durable goods. HOLY MOLY! Four months after the 2020 recession, durable goods consumption returned to and surpassed its previous peak – And then kept on growing! Two years after the start of the recession, durable goods consumption was up 24.2%! Again, after the 2007 peak, recovery is an inapplicable term for the next two years.

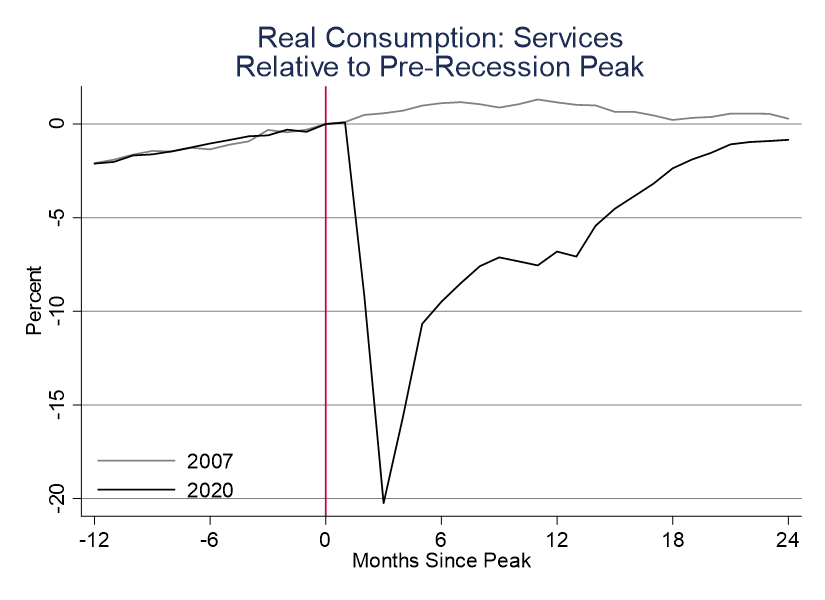
But all has not been peachy-keen in the land of Oz. Services are the largest component of consumption expenditures (64% prior to the 2020 recession). But they are also most characterized by close physical proximity (except for digital services). Service consumption has still not reached its pre-pandemic peak from 2 years ago and the growth appears somewhat asymptotic to a lower level. Eighteen months later and service consumption has settled between 60% and 61% of all consumption spending, but about 0.8% below the previous peak. Contrast this pattern with the 2007 recession in which there was hardly any movement for better or worse. After the 2007 peak, service consumption plateaued, more or less, for two years.
The 2007 and the 2020 recessions had very different causes and very different policy responses. As a result, they had very different patterns of decline and recovery. Whether the recoveries were mostly determined by the initial shock or by the policy response is not an easy question to answer. It’s complicated. But, all the same, measures such as RGDP, employment, and real consumption can give us a broad view of how deep the recessions were and how energetic the recoveries were. One could characterize the 2007 recession as a soft landing. One could also characterize the subsequent recovery as a prolonged failure to launch.
Looking at real variables, the 2020 recession had a successful recovery. More or less, it’s what we might consider ‘textbook’. But, anything more detailed than the most aggregated indicators reveals that the 2020 recession and recovery was qualitatively different. Employment is still not fully recovered and nor is consumption of services. Ironically, the first post-smartphone recession was followed by booming consumption of durable goods. The next recession will probably not be caused by a pandemic. But I suspect that we can rest assured that the next time will be way different too.

Reblogged this on Utopia, you are standing in it!.
LikeLike
Inflation looks very different this time too
LikeLike
Absolutely. I focused on reals intentionally.
Although conservatives/Republicans have complained about inflation, Austrian type economists have said that negative supply shocks*should*result in higher prices (To reflect the underlying scarcity).
Although, it may be that that negative supply shock was more transitory than monetary policy could accommodate.
LikeLike