My university recently hosted a guest speaker. Among their content, they included some nominal macroeconomic values from pre-2020, back in the era when inflation was very low. That roughly includes the years 2012-2019. Truly, inflation stayed below 2% through February of 2021, but I think that we can all agree that the economy was different in a few ways beginning in 2020.
I asked the speaker why not express the nominal values in real terms. They were emphatic that the low rates of inflation at the time implied that the signal-to-noise ratio was too low. Therefore, the ‘real’ inflation adjusted values would not be more precise because excessive noise would be introduced into the series during a period when not much deflating was necessary in the first place.
My answer to this is a firm ‘maybe’. It makes sense and it’s plausible (Jeremy has written about error and revisions in the past). We can think about the noise in price indices in a few ways.
1) It may be information is incomplete and becomes more complete as time passes. This sort of noise only exists in the short-run and is resolved as more information becomes available later in time. Revisions tend to happen each month for prior months, as well as each year for prior years. There are also big revisions after methodological, consumption weight, and data source changes.
2) Another type of noise is due to incomplete information that is never resolved. After all, the government statisticians can’t see literally all of the transactions. Those unobserved transactions will never make it into the official inflation measures and we’ll never get a perfect picture.
3) Methodological artifacts may also include known biases. This type of noise doesn’t get corrected except after major changes to the series. If those changes never happen, then we just sort of live with imprecision. Luckily, so long as the bias is consistent, then percent change in the price indices will approximate the underlying true levels. However, if there are non-random biases in the percent change, then it can cause some trouble.
One way to get an idea for the amount of noise in the data is to observe the magnitude of revisions. Of course, this only helps us with the first type of noise above that eventually gets resolved with more information. It’s much harder to get a handle on the imprecision that is not identifiable. The Philadelphia Federal Reserve Bank provides an easy-to-use database that puts all of the archival and revised numbers for many macro series in a single place: the Real-Time Data Set (RTDS). It includes every historical PCE price index value for each publication month. Let’s limit our sample to the 21st century.
The first thing that stands in our way is that periodically the PCEP gets ‘re-based’, so that some year’s average equals 100. The PCEP has been re-based 5 times in the 21st century. For comparability, I scale every release to match where the average value of the index is 100 in the year 2005. The earliest release in the archive is from August 2009 and the latest is from April 2026, giving us 201 monthly releases. Each value on record goes out an incredible 3 decimal places, allowing us to measure revisions that are as detailed as 0.001%. I use the word ‘incredible’ intentionally. Nobody believes that the numbers are nearly that precise. But we can make the comparison anyway.
Now we can compare a month’s initial release to its revised value some months later. Below are the h horizon revision changes. Specifically, it’s the percentage that the initial reported price level deviates from the revised value at a horizon of h∈ {1,3,6,12,24} months. At h=1, the revisions seem to be mostly white noise. As we increase the revision horizon, we can see more cyclicality. Positive numbers are initially overestimates of price levels and negative numbers reflect initially underestimated price levels.
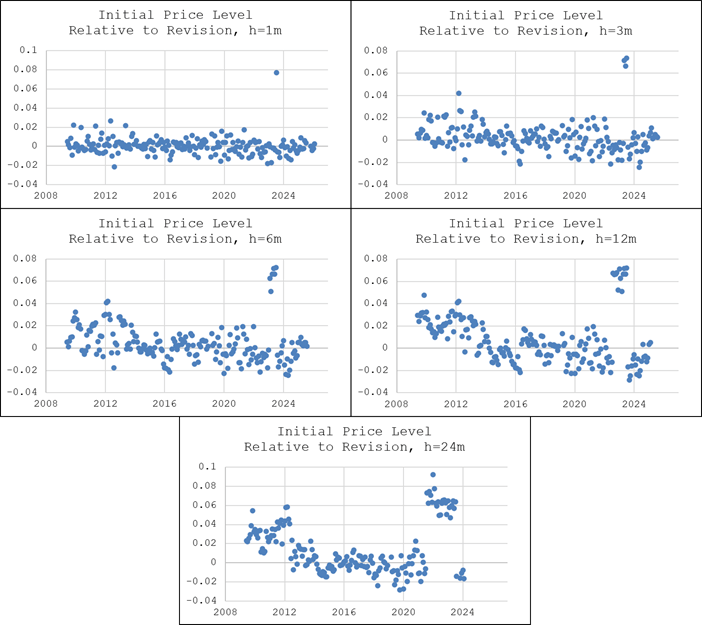
You might notice the cluster of very high values around 2023. That’s a statistical artifact. In October of 2023, the BEA adopted new weights, redefined a few things such as digital services, and accessed more comprehensive IRS and census data. The updated methods and data show up in the August numbers that were released in late September. That change revised *all* of the preceding record. The changes eliminated about 8% of the cumulative inflation that had occurred since 2005 in the prior series. So, all of the revision horizons that cross the September-October 2023 threshold get the artifactual bump. This discrepancy is unfortunate, but it also keeps the comparison consistent across the entire sample.
You may not recall hearing about the 8% collapse in inflation. This is because the new numbers are always compared to the *revised* values. So, when all of the historical values changed in 2023, the monthly rate of inflation and the year-over-year numbers were both based on the new index values for the historical reference periods.
Is there anything useful in the graphs? Yes. At all horizons, the magnitude of revisions appear to be auto correlated. That is, there tend to be periods of initial overestimates and underestimates. The initial price level reports tended to be overestimated after the Great Financial Crisis. After the artifactual jump, it does seem like most recent initial reports have tended to underestimate inflation. So we see subsequent upward revisions.
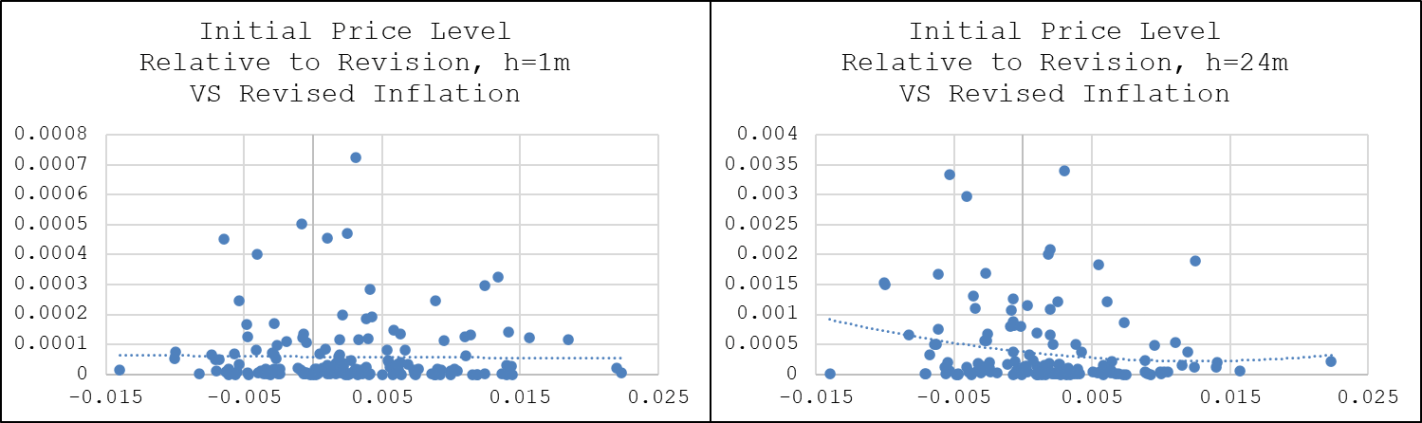
What about the initial claim by my guest speaker that lower rates of inflation contain a larger noise-to-signal ratio? Below are scatter plots of the squared revisions vs the revised monthly inflation numbers. At h=1, there is no pattern. At h=24, revisions tend to be negatively associated with inflation such that there are, again, bigger revisions for lower rates of inflation than higher rates. So, measuring observable noise in the inflation numbers as the difference between the initial and revised price levels does seem to support my guest’s assertion. However, do note that the data is noisy and that the first and second derivatives in both of the below graphs are only slight. But even white noise is evidence in favor of my guest because white noise implies that price level revisions are just as big during low rates of inflation – implying that they are revised by a higher proportion.
Over the course of five or maybe even ten low-inflation years, I can see the argument that adjusting for inflation may not provide meaningful information on an annual basis. We can probably get away with adjusting the tenth year only and still make the same point that we want.

These days folks keep bragging about how [nominal indicator] is at record highs. Most of these things need to be inflation adjusted! Even simple stuff like “the school raised more money at Winter Festival than ever before” is crazy because like a burger is $10 now.
LikeLike
Didn’t know the Philly Fed offered that data, it’s a great resource. I’ve been burned in the past trying to forecast real time releases using models I built with revised historical data
LikeLike