Over the years, many people have tried to create alternatives to the CPI for measuring inflation. Probably the most famous is “Shadow Stats,” which Tim Lee has convincingly shown isn’t actually measuring price inflation (it’s just adding a fixed factor to the CPI).
But the CPI critics keep coming. One that was recently released is called the “Reality Index.” This index tries to improve on the CPI-U in two ways. First, it uses fixed weights for the items in the basket, and importantly it uses the 2024 weights and applies them to past years (this is called a Paasche index). Second, it takes out some BLS prices to avoid using hedonically adjusted prices, and other price calculations that the Reality Index author thinks are weird.
Both of these changes are problematic. I will explain why.
1. Fixed Basket of Goods/Services Doesn’t Make Sense
Many critics of the CPI complain about the shifting weights in the CPI. “We just want to measure the cost of a fixed basket over time.” But measuring a fixed basket over time isn’t actually that useful. I will explain why in a moment. But that’s not even what the Reality Index does! Instead, it takes the 2024 CPI weights (which come from the Consumer Expenditure Survey), and then consistently applies those weights to past years. The Index isn’t measuring the cost of a fixed basket of goods from some past year — it is using the 2024 basket, and assuming that’s what people consumed in the past.
The author of the Reality Index, Tom Elliott, is either confused about this or is being deliberately misleading, for example in a recent WSJ essay promoting the Index, he says “That same basket, the one the government says rose 1.87 times since 2000, has actually risen about 2.4 times.” But that’s false. To do that calculation, you would need to use the 2000 CPI weights and follow them forward to 2024 (this is called a Laspeyres index). Instead, he uses the 2024 weights and follows them backwards. He could do the calculation that he references in the WSJ essay, but he does not.
To see why this is a bad approach, let’s compare the weights in the Reality Index with a few past years. I have done my best to translate the weights for the 10 categories listed on this page to actual BLS categories, though I will admit that none of their category weights matched exactly to what I found at BLS. But I’m pretty confident it is correct.
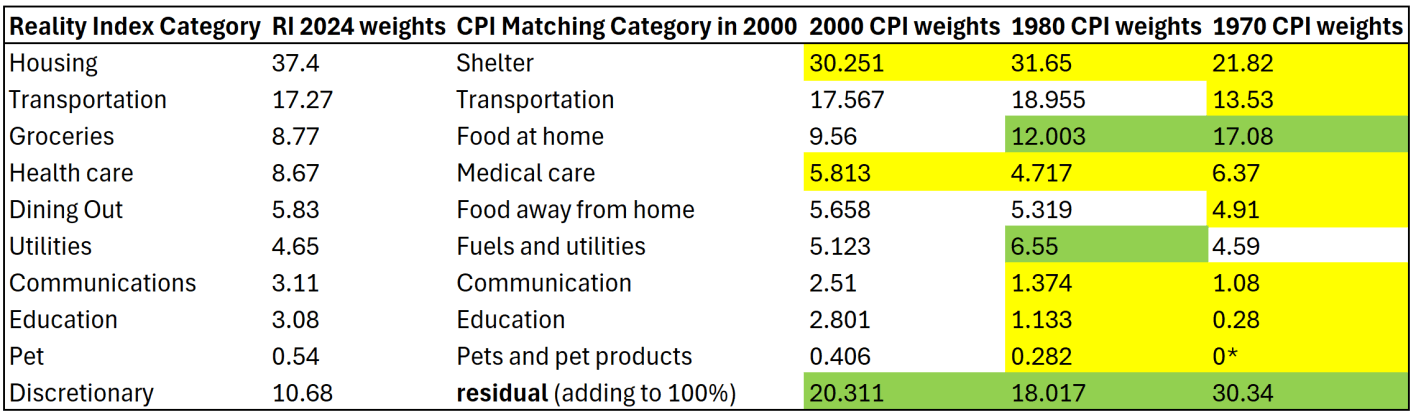
I am also pretty confident that the “discretionary” category is just a residual for everything that wasn’t in the other 9 categories, though I can’t find them explicitly saying this. Yellow highlighting indicates the category in past years was smaller than the 2024 weights. Green highlighting indicates past years were larger weights.
The first thing you might notice is that the CPI weights have changed significantly over time. Relative to 1970, housing/shelter gets almost twice as much weight today. Conversely, groceries/food at home gets about half the weight today as it had in 1970. The “discretionary” category (the residual to make it add to 100%) used to be 30 percent of a household budget, using this approach! That should really give you pause: do we really think a typical household in 1970 considered 30% of their budget to be “discretionary”? I highly doubt it. That discretionary category includes clothing, which was over 10% of household spending in 1970 (it’s around 2% today).
Related to that, you may also notice that categories which have had above average inflation over this time frame — such as housing, healthcare, and education — all have bigger weights today than in the past. Meanwhile, food and clothing have seen less price inflation, but they are weighted much less. This process will tend to overstate inflation of the past, as the CPI in 1970 placed less weight on, say, housing, so when you put more weight on it, of course the inflation rate will go up. And indeed, as the Reality Index’s historical analysis shows, the biggest gaps in inflation between the RI and CPI were in the 1970s (4.9% gap in 1979 and 4.7% gap in 1978). But this is ahistorical: people were not spending 37% of their budget on shelter in the 1970s! In fact, they were spending almost as much on groceries in 1970 as they did on shelter.
The Reality Index is essentially projecting backwards to a fake reality of the past, because it uses the 2024 weights in all past years. But this isn’t capturing anything real about the world, and it is at best an interesting thought experiment. Of course, part of the reason people now spend more of their budget on housing and healthcare is because they have gotten more expensive and to some extent crowded out other spending. But they are also categories we might expect demand to increase as incomes increase (normal goods). And notice this is the opposite of the standard critique of the CPI: as things get more expensive, critics claim the CPI assumes people spend less on those items. Instead, the CPI-U weights are updated each year based on the latest Consumer Expenditure Survey data, and goods/services with higher rates of inflation now consumer more of the weight of the CPI than in the past.
(*Note: the “pet” category is listed as 0% in 1970 because BLS didn’t itemize it separately due to it being so small. That’s of little consequence, since it is such a small share in every year — I’m surprised they didn’t just stuff pets in the discretionary category.)
2. Swapping Quality-Adjusted Measures for Nominal Prices is Often a Bad Idea
Using the 2024 weights for past years is reason enough to not find the Reality Index useful. But let me just say a few words about the substitute prices that the Reality Index uses. The changes are either trying to use something that isn’t hedonically adjusted for quality, or to overcome some of the strange calculations, especially for housing and health care.
First, on the hedonic adjustments, the Reality Index methodology gets something wrong: “BLS adjusts prices downward when product quality rises, but does not symmetrically adjust upward when product quality falls.” BLS performs hedonic adjustments in both directions, and most of the adjustments are for apparel and shelter. For example, if an inferior quality fabric is used, BLS treats this as a price increase. It is true that, on balance, the hedonic adjustments tend to lower the rate of inflation (perhaps this is what they mean by “symmetrically”), but this is a much smaller issue than most suppose: outside of apparel and shelter, hedonic adjustments only lower the rate of reported CPI inflation by 0.005 percent per year.
For the biggest category, shelter, they critique the “owner equivalent rent” calculation BLS includes in the shelter component (it’s the largest part of the largest CPI component). OER is worth critiquing, but there is also no perfect way to measure housing costs. But we don’t actually need to get into the weeds too much with that, for a simple reason: the substitute housing measure RI uses isn’t dramatically different from the CPI-Shelter category. The Reality Index’s housing component rose from a value of 100 in 1980 to 510 in 2025. The CPI-Shelter index rose from 100 to 512 (July 1980 to July 2025), almost the exact same increase! They went through a lot of work to reconstruct the housing component and got… basically the same result.
How they describe the increase in housing prices is extremely deceptive: “Housing is where the Reality Index and the official CPI diverge most.” But that’s completely false. It is true that housing costs have increased faster than the overall CPI… but that’s also what the CPI-Shelter component shows. What they have done in the RI, though, is what I described in Part 1 above: they gave it a lot more weight in the past than consumers actually spent on it. This biases their index upwards to show more inflation than actually happened.
The calculation of medical care costs and health insurance in the CPI is also very complex, and thus many are skeptical of this too. The RI wants to substitute in several measures of the cost of health insurance directly, as well as a measure of out of pocket spending. Including health insurance costs is problematic because for the majority of Americans, a lot of these costs are paid by their employer. RI doesn’t appear to have isolated the cost to employees alone. Also, even if premiums are rising, if there are offsetting changes in deductibles or other cost sharing, the premium increases may be deceptive (indeed, BLS’s method for calculating health insurance cost is explicitly designed to account for this). But it is also interesting to look at one component they use for out-of-pocket health expenses. This category increased from a value of 100 in 1987 to 380 in 2024. If we look at the CPI medical care costs component over this time frame, it increased slightly more: from 100 to 432. Slightly more, but about the same! Again, the major change is putting too much weight on health care in the past years, not that they are actually capturing a bigger increase.
I won’t say too much about their education variable, since I can’t even find a landing page or chart for it on their website. But I will note that they are doing the exact opposite for this component of what they should be doing: they use the sticker/list price of college, rather than the net/actual price that students pay. If the goal of the Index is to see how much people actually pay for things, you should look at what they actually pay. And college tuition, especially today, involves a heavy amount of discounting through grants, scholarships, other aid, and just plain discounting. Guess what? The CPI-Tuition component does account for discounting (at least since 2003 it has). This isn’t a hedonic adjustment or other trickery, it’s a measure of what people actually pay.
In the end, the big new items they substitute in the index are questionable, but ultimately don’t matter that much for the end result. It’s Part 1 above, the ahistorical weighting, that drives most of the RI’s results.
3. Instead of Asking AI If It Can Do Something, Ask It If You Should
The author of the index acknowledges that the task of creating this index was greatly enhanced by the improvements in AI, specifically using Claude in this case. And no doubt it was, as he explains before AI it was a monumental task that he was never able to complete: “the project would not exist without it.” Seems like a great use case for AI.
However, here’s a good rule of thumb for using AI: instead of just diving in and asking it to do a big project, maybe first ask it if the project makes sense. Here’s a few things Claude (free version!) had to say about a fixed-basket price index:
“A fixed basket is a reasonable approximation over short periods, but it systematically overstates inflation over longer horizons due to substitution and new goods. That’s why most serious price measurement today uses chained or superlative indices rather than a purely fixed basket.”
When I asked Claude if this fixed-basket index was good for inflation adjusting income, it replied:
“A fixed basket (Laspeyres) index overstates inflation. So if you use it to deflate nominal income, you’re dividing by a number that’s too big, which means your real income estimate comes out too low — you’re making people look poorer than they actually are in welfare terms.”
And when I pressed on the actual approach of the Reality Index, which is not really use a fixed basket, but instead backwards-casting current weights on to older years (referred to as a Paasche-style approach, distinct from the Laspeyres-style index):
“Casting today’s weights back to the 1970s is probably worse than using a historical basket, not better. The historical basket at least reflects what people were actually buying. The chained index approach — updating weights frequently so you’re never too far from actual behavior — is the more defensible solution, though it still doesn’t fully solve the new goods and quality problems at very long horizons.”
Following the above conversation, I asked Claude for its assessment of the Reality Index methodology. It praised some things (like a different housing cost measure, although it pointed out flaws in this approach too), but here was Claude’s bottom line:
“More rigorous than the typical ‘real inflation is secretly 15%’ internet content. The data sourcing is solid and the limitations section is unusually honest. But the index is best understood as a political-economy document — it’s measuring ‘the cost of the things that feel expensive’ rather than offering a comprehensive alternative to CPI. That has value as a conversation-starter, less as a macroeconomic tool.”
You can read the conversation with Claude at this link.
It turns out, economists have thought long and hard about how to construct price indexes, and many of their best ideas are currently in place in existing price indexes, especially chained price indexes. The Reality Index will not be the last attempt to provide a “better” alternative to CPI, but it makes errors so fundamental that it is worth using as an example of what not to do when creating an alternative. The CPI is not above critique, but the Reality Index doesn’t offer any suggestions to improve the CPI.

If you want a single fixed basket, you might be better off keeping it simple and using something like the Big Mac index?
At least that’s a lot less hassle, and doesn’t seem like it would have given them much worse data?
LikeLike