In a post from July 2021, I discussed housing affordability and “zoning taxes” — in other words, how land use restrictions such as zoning were driving up the cost of housing in some US cities. San Francisco, Los Angeles, Seattle, and New York stood out as the clear outliers, with “zoning taxes” adding several multiples of median household income to housing costs.
The paper I was summarizing used data from 2013-2018, and it’s a very well done paper. But so much has changed in the US housing market since that time. In my post, I pointed to a map from 2017 showing that a large swatch of the interior country still had affordable housing — loosely defined as median home prices being no more than 3 times median income.
To see how much has changed so quickly, consider these two maps for 2017 and 2022 generated from this interactive tool from the Joint Center for Housing Studies.


Notice that in 2017, much of the interior of the country from the Great Plains down to Texas, and over to the East Coast (except for MSAs right on the coast) was generally what we would consider “affordable”: dark blue in color (housing prices under 3 times income levels) or at least in light blue (housing prices 3-4 times income levels).
But just 5 years later in 2022, the dark blue MSAs are almost completely gone, and the light blue ones are vanishing too.
In my July 2021 post I concluded by saying that “As demand increases, and supply-side restrictions remain in place, we would predict the same thing will happen to Columbus as happened to San Francisco. But probably not for decades.”
I was wrong. It didn’t take decades for Columbus and similar cities start to see zoning regulations really start creating a binding constraint on supply. It only took a few years (and by the time I was writing in 2021, it was basically already true, we just didn’t have the data yet). The following chart shows annual data for this same home value-income ratio for Columbus and three other cities that were relatively affordable from 1999-2017 but are now creeping up into unaffordable territory.

The old “zone of affordability” that I talked about a few years ago is largely gone.
But to make matters worse, let’s consider four other cities that are generally considered the epicenter of the early 2000s “housing bubble” in the US. Important note: the y-axis is very different from the prior chart!
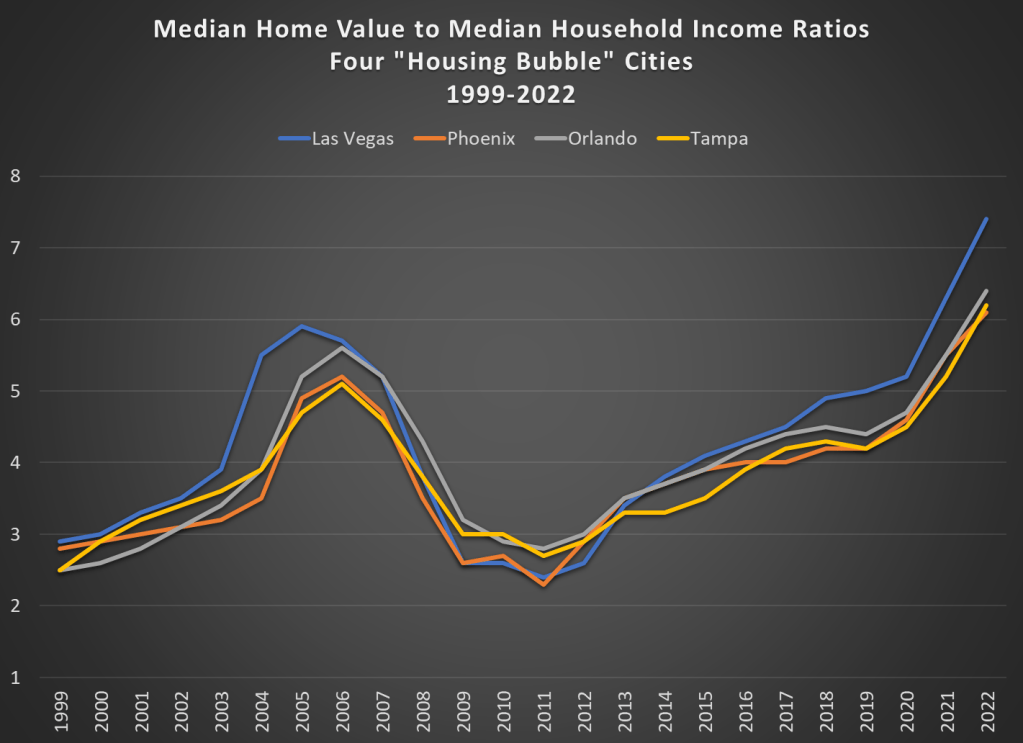
The pattern for Las Vegas et al. looks a bit different. These MSAs went from affordable in 1999, to unaffordable in 2003-2007, then back to affordability for a few years. Now they are clearly back to unaffordable territory, with home prices at 6 or even 7 times incomes. For each of these four cities, that’s even higher than the peak of “housing bubble.”
I put “housing bubble” in quotation marks several times above for a specific reason. You could look at both of those charts and say “wow, it looks like we are in another housing bubble, and now it’s spreading across most of the country, not just a few cities.” In fact you can find people (including Robert Shiller) saying as far back as 2013 (more than 10 years ago!) that Las Vegas was once again in a housing bubble.
But this reaction is contingent on granting that the increase after 2003 in Las Vegas et al. was in fact a bubble, which most of us take to mean an asset bubble that was inflated by speculation which was, in hindsight, unwarranted. It looks that way in the chart! And indeed, most observers at the time and since have called it a “bubble.” But what if it wasn’t a bubble? What else could it be?
The alternative explanation of the rise in housing prices in the early 2000s is clearly stated by Kevin Erdmann and others as a situation where demand in particular cities was growing much faster than supply was able to expand. The increase in housing prices was bad from a social perspective, but it made perfect sense given the constraints (zoning, etc.). In this telling of the history, it was a housing boom, not a bubble, but a boom that ran up against inflexible supply constraints.
Why then did housing prices crash? That seems to indicate “bubble” is a better explanation than “boom.” The alternative explanation for the crash (stated most clearly in Erdmann’s book, but this summary by Tim Lee is also very good) is that through a variety of federal policies (including Fed policy) we killed demand. The bubble didn’t pop because of its irrational nature. It “popped” because policy popped it. The resulting recession in 2007-2009 was thus possibly avoidable, in this telling of the history.
I hope I’ve explained the Erdmann hypothesis correctly, as I’ve just come to fully digest it myself. I will say that I’m convinced it’s probably correct. Maybe you aren’t convinced yet (read his book), but grant for a moment that he is correct about the history. What does it imply for the housing market today?
One implication is clear: don’t “pop the bubble”! This won’t solve the problem of unaffordable housing, and it will probably lead to a recession. You can only solve the unaffordability problem by increasing the supply of housing. Subsidizing demand won’t work — it will only increase prices further. Suppressing demand won’t work — it will leave people in other unaffordable situations (much of the increase in Las Vegas et al. was due to migration from cities with even worse housing situations), and may cause a recession.

Nice work, thanks. Much to think about here. Not disagreeing with impact of zoning, but not sure your analysis captures what seems to be accepted fact these days, that mortgage lending standards were extremely lax in say 2004-2007 timeframe, so anyone and his dog could get a mortgage, whether they could really afford it or not. Hence runup in prices, and belated runup in construction, which led to glut of houses at least in certain areas 2008-2011; which in turn led to underbuilding for a decade, which in turn gives rise to shortage….
Also, from what I have read, builders have been hugely incentivized in past decade(s) to build only higher-end homes and “luxury” apartments, which would tend to push average housing prices higher.
LikeLike
The argument that lax lending standards caused the bubble is addressed in Erdmann’s book, and I can’t really do the full argument justice in a short comment. But I would also recommend this Glaeser et al. paper, which tries to test empirically whether low-interest rates or lax lending standards caused the increase in prices. They conclude that perhaps 20% of the increase in prices was due to low interest rates, but lending standards didn’t play a role: https://www.nber.org/books-and-chapters/housing-and-financial-crisis/can-cheap-credit-explain-housing-boom
LikeLike
Scott, I hope it’s ok if I insert myself here.
Here is a link that includes 4 papers on this issue. One thing I have found is that inadequate housing supply creates an asymmetrical pattern in housing costs across a metro area that can be measured. (Paper #2) With this variable, I can more comprehensively and accurately account for metro area supply and demand differences, which most studies try to simply control for and discard. When I do this, (Paper #4), I actually find stronger evidence for the effect of loose lending on some price appreciation in 2002-2006 than much of the current literature does (I think the scale of the effects I find are in the ballpark that Sinai and Glaeser find in the link Jeremy posted.) But, supply constraints are much more important and so are demand shocks (such as domestic immigration flows). The regional demand shocks were actually a side effect of regional supply constraints in other regions that triggered migration. And, much of the reversal in prices came from novel new restrictions on lending rather than a reversal of previous lending excesses.
Anyway, if you’re interested, the papers are at the link, along with some summaries in the form of substack posts, twitter threads, etc.
https://kevinerdmann.substack.com/p/research-roundup
LikeLike
Great input, Kevin, thanks.
Maybe I have been too much influenced by the movie The Big Short for my perspective on the pre-2008 housing bubble…
LikeLiked by 1 person
Oops. “Paper 4” should be “Paper 3”.
LikeLike
Scott, The Big Short is a great movie, and gets the details of its observations correct better than maybe any other movie I know of. The main problem it has, which is a problem across the literature, is that it thinks it’s a movie about the inevitable winding down of a bubble, when it is really a movie about the early stages of a deep housing contraction caused by a country full of people mistakenly convinced that they must wind down a bubble. 😉
LikeLike
Thanks for posting this. I work in energy policy and often interact with folks working on housing policy. I notice that groups advocating for solutions to increasing housing and rental prices don’t have the right understanding of what’s been driving housing shortage. The solutions they propose – although well intentioned – aren’t likely to help increase housing supply and may hurt supply. E.g., see: https://justiceforrenters.org/about-us/
What concerns me is the lack of interaction between groups with political power and analysts best suited to help develop solutions. Part of the reason, I think, is distrust of economics in many factions of the left and right.
LikeLike