You may have seen on your social media recently that the price of TVs has fallen 98% since 2020. That’s certainly what the data from the BLS says. This would seem to imply that a one-thousand dollar TV in the year 2000 would now be priced at $20. While we have seen amazing things in the market for TVs, we’re not seeing $20 TVs. One take away might be that the data is just wrong. But that data is always wrong. The question is how the data is wrong and whether it’s a problem.
The reason for the disagreement between the data and the price on the shelves is due to something called ‘Hedonic Adjustment’. The idea is that some goods have quality features that change over time, even if the price doesn’t change so much. In the case of TVs, we might see higher resolution, flatter screens, larger screen sizes, smart features, etc. TVs are not a stable set of qualities. They are a bundle of characteristics, and those characteristics have some wiggle room while still satisfying some sensible criteria for being a TV. In theory, every single good is a bundle of services that we value. The reason that the some CPI categories have fallen so much is not only because the price has fallen necessarily. Rather, the amount of services that we get from a TV has increased so that each dollar that we spend can purchase more of those TV features.
Continue reading for the gif.
The idea of consumer hedonics goes back more than a hundred years, but became more formalized in the 1960s & 1970s (Lancaster 1966; Ladd and Suvannunt 1976). What makes hedonics different from classroom economic models is that the characteristics of a good *must* be consumed in a fixed proportion. It’s kind of like the case of consumption complements. Some goods go well together and result in less satisfaction when you have ‘too much’ of one relative to the other. Hedonics are different in that the ratio of services that a good provides are fixed and that the relative amounts within a single good are fixed. It’s not just that you’re happier with some ratio of services, it’s that the consumer can’t control the services that are contained in a single good.
¡Hedonic Frijoles! An Example
Here’s a very simplified example. Say that you have only two food characteristics that you value: Protein content and Carbohydrate content. Also say that you can spend your money on rice and chickpeas. While life would be simple, you can choose how much of either to eat. Below is a table of price, protein, and carbohydrate content per 100g of food and the price per gram of nutrient (See also the mythology the of rice & beans).
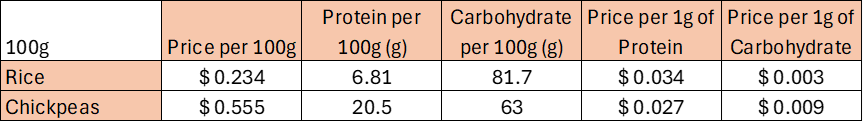
The ratio of protein and carbohydrate is fixed for each type of food. We can graph the protein-carb mix for each rice and chickpeas. If we have a budget of, say, $10, then we can also add a notch for the maximum quantity of proteins and carbs that we can afford. The distance of those vectors is what the CPI calculates.
Imagine that there is a rice-breeding innovation that increases rice’s nutritional content without affecting the price. Even though the price of rice is no different per gram, the price of the characteristics which compose it have fallen and we get more of the valuable features out of the same thing that we call rice. This is what is happening to TVs. The prices have fallen some, but the features that are built-in are much cheaper than they used to be. That’s what the CPI is telling us. The features that make TVs worth buying are 98% cheaper than they were in the year 2000.
They don’t know how we necessarily feel about carbs and proteins – or screen size and pixels, but they do know how much we can afford when we buy or rice or beans – or tvs. We can afford any combination of protein and carbohydrate that lies between those two notches. All we have to do is substitute between chickpeas and rice.

Once you have a menu of portions, it’s up to individual preferences about protein and carbohydrate to determine the best mix of rice and beans (the golden dot). The left portion of the purple line segment represents the portion of chickpeas that we eat, and the right portion represents the portion of rice that we eat.
Food prices and nutritional content are from the Mythology of Rice and Beans post.
Ladd, George W., and Veraphol Suvannunt. 1976. “A Model of Consumer Goods Characteristics.” American Journal of Agricultural Economics 58 (3): 504–10. https://doi.org/10.2307/1239267.
Lancaster, Kelvin J. 1966. “A New Approach to Consumer Theory.” Journal of Political Economy 74 (2): 132–57. https://doi.org/10.1086/259131.

One thought on “¡Hedonic Frijoles! …And Televisions!”