In aggregate, consumer spending on different broad categories of goods is relatively stable. The year 2019 feels like forever ago – and it was more than half a decade ago. But since then we’ve been hit by a pandemic and an AI shock and a trade war, and tariffs, and… plenty. We live in different times. Except, broadly, consumers are spending their money much as they did six years ago. Let’s compare some data from the 2nd quarter of 2019 and 2025.
First the Spending
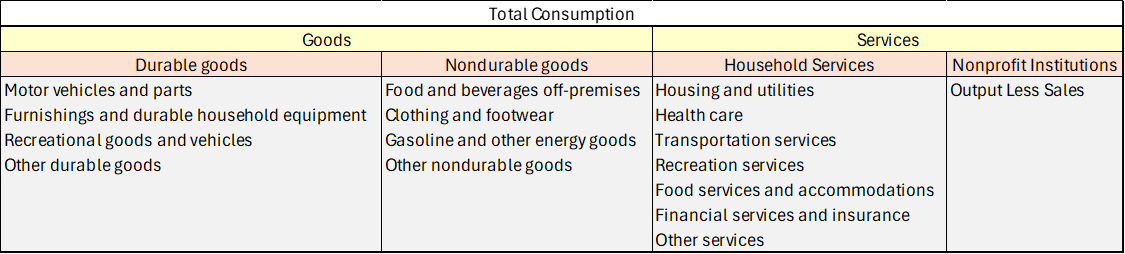
Consumption spending is categorized in the below table.
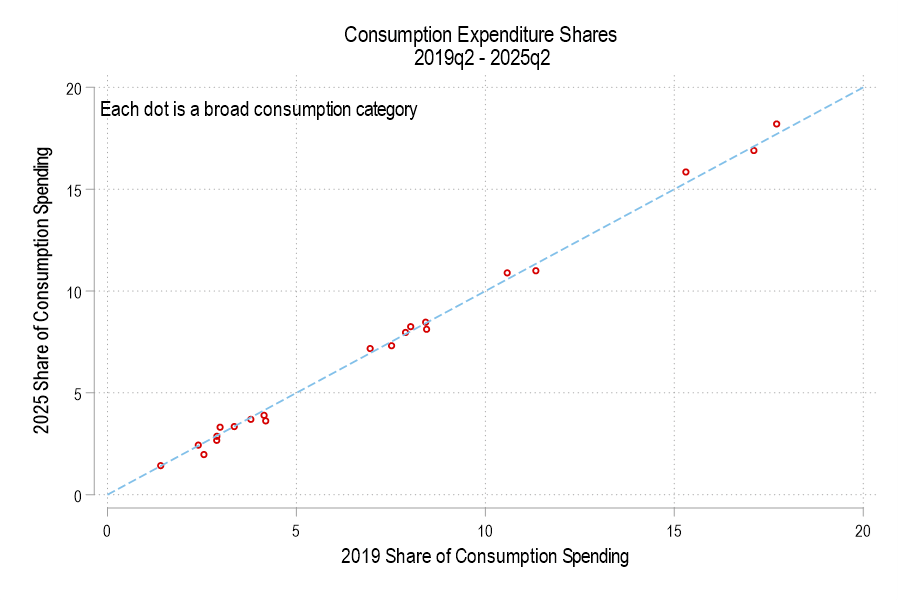
If total consumption spending (not inflation-adjusted) is 100%, then how has the allocation of spending changed? Below is a graph comparing each consumption component’s 2019 share versus 2025. The dotted line denotes an identical share. I haven’t labeled the categories because, suffice it to say, that spending shares are little different. None is more than one percentage point different.
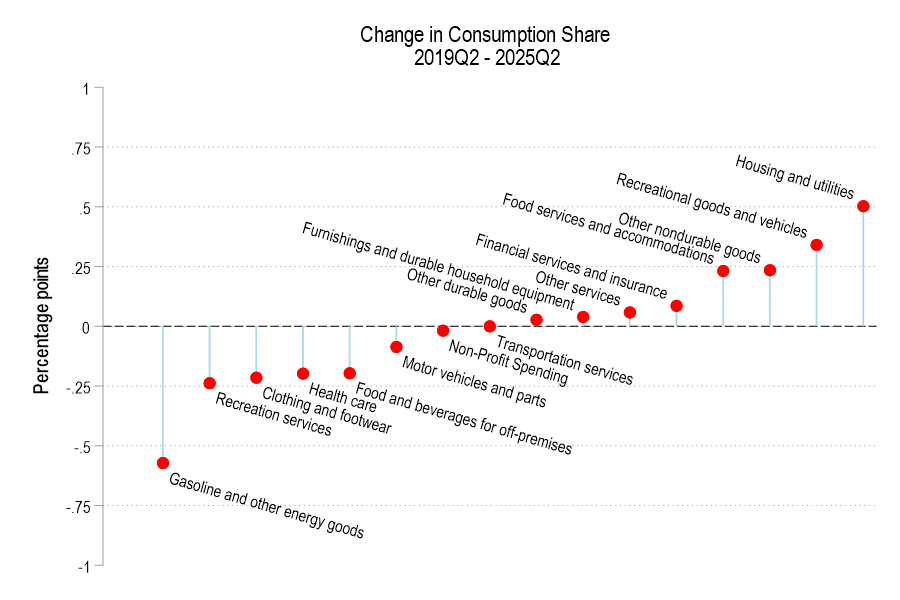
The below figure displays the spending share difference. We’re spending less of our consumption on gasoline and the like, recreational services, and clothing. Surprisingly, we’re also spending less on healthcare and food for off-premises consumption (non-restaurants). However, we’re spending a greater share on housing, recreational goods, food services for on-premises consumption (restaurants).
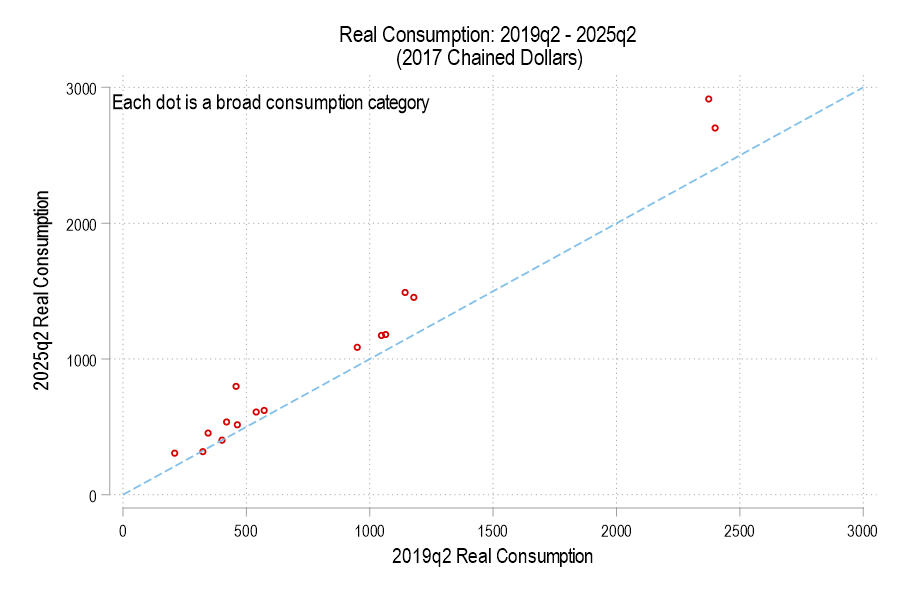
Let’s get Real
The big asterisk is that we don’t know by the above figures alone whether the changes in spending are good or bad. It could be that prices rose and people spent more without enjoying more of what they want. It could also be that we buy more and spend more to make it happen. The former is bad for consumers, the latter is good. In some cases, it’s probably both. In this vein, let’s look at how real, inflation-adjusted consumption changed. The below graph plots real consumption (2017 chained dollars) in 2025 vs 2019. We consume more of nearly everything!
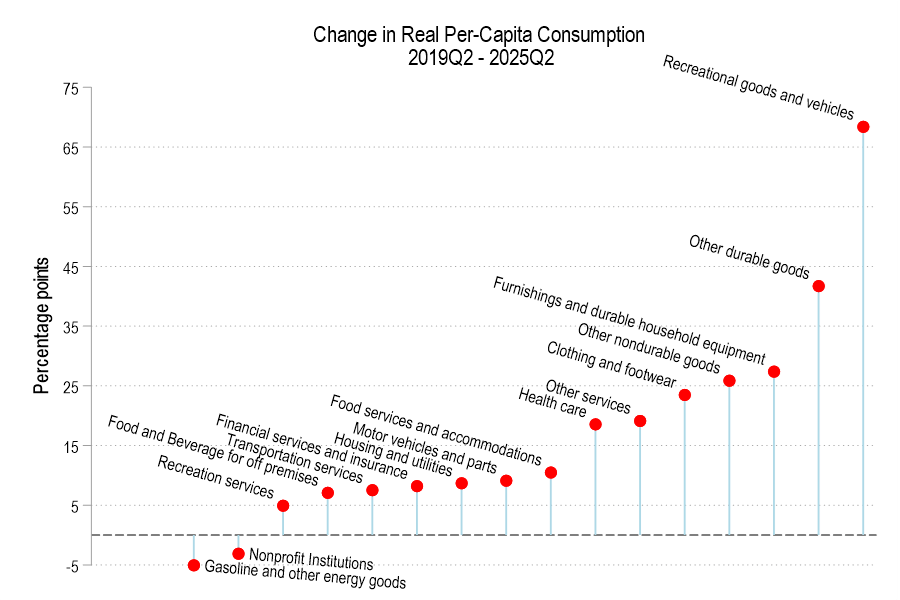
Of course, this above graph is just aggregates. Our population changed over this time too. The below graph shows the percent change in per capita real consumption. We are much richer than we were in 2019! The only areas of lower consumption are for heating fuels and non-profit transfers. Everything else is up by a lot. Specifically, ‘recreational goods and vehicles’ growth has been driven by greater purchases of sports equipment (including guns) and image/video/audio processing equipment and media. We also afford more of all of the other areas too (including housing). Each type of consumption occupies a stable share of our expenditures, but we are living lives of greater real income and leisure!