Declining fertility rates have been in the news a lot lately, and with good reason. Some countries, such as South Korea, have seen massive declines in fertility rates, and they face huge social problems and population decline resulting from these declining rates. But does the United States face the same problem?
To be clear, fertility rates are down in the US. Using the most common measure, the total fertility rate, births per woman in the US fell from a peak of over 3.5 births at the peak of the Baby Boom in the late 1950s and early 1960s, to around 2 births per woman in the 1990s and 2000s, and fell further to 1.6 births in 2023 (note: it had been around 2 births in the 1930s as well — the Baby Boom was a very real).
But the total fertility rate, or the number of births per woman of child-bearing age (usually 15-49) in a particular year is not a perfect measure. As Saloni Dattani clearly explains, if the timing of births is changing, this can make the TFR temporarily fluctuate. If women on average are delaying births to a later age, the TFR will fall initially even if women end up having the exact same number of children.
An alternative measure suggested by Dattani is the completed cohort fertility rate. This measure looks at the total number of children that women from a particular birth year in a country have throughout their child-bearing years. This rate also shows a decline for the US, but it is much more gradual: for women born in the 1930s (who would eventually become mothers during the Baby Boom), they peaked at about 3.25 births per woman, which declined to right at about 2.0 births in the 1950s (the Baby Boomers themselves), and has gradually risen since then to about 2.20 for women born in the early 1970s.
How does the US completed cohort fertility rate compare with other countries?
Using data from the Human Fertility Database — which gathers comparable fertility data from 34 countries, mostly high-income democracies (plus Russia and Belarus) — we can make some comparisons. The most recent year of data for the US is for women born in 1979, though there are only 11 other countries with data that recent. If we go back to 1978, there is data for 20 countries. Here is the ranking:
Figure 1:
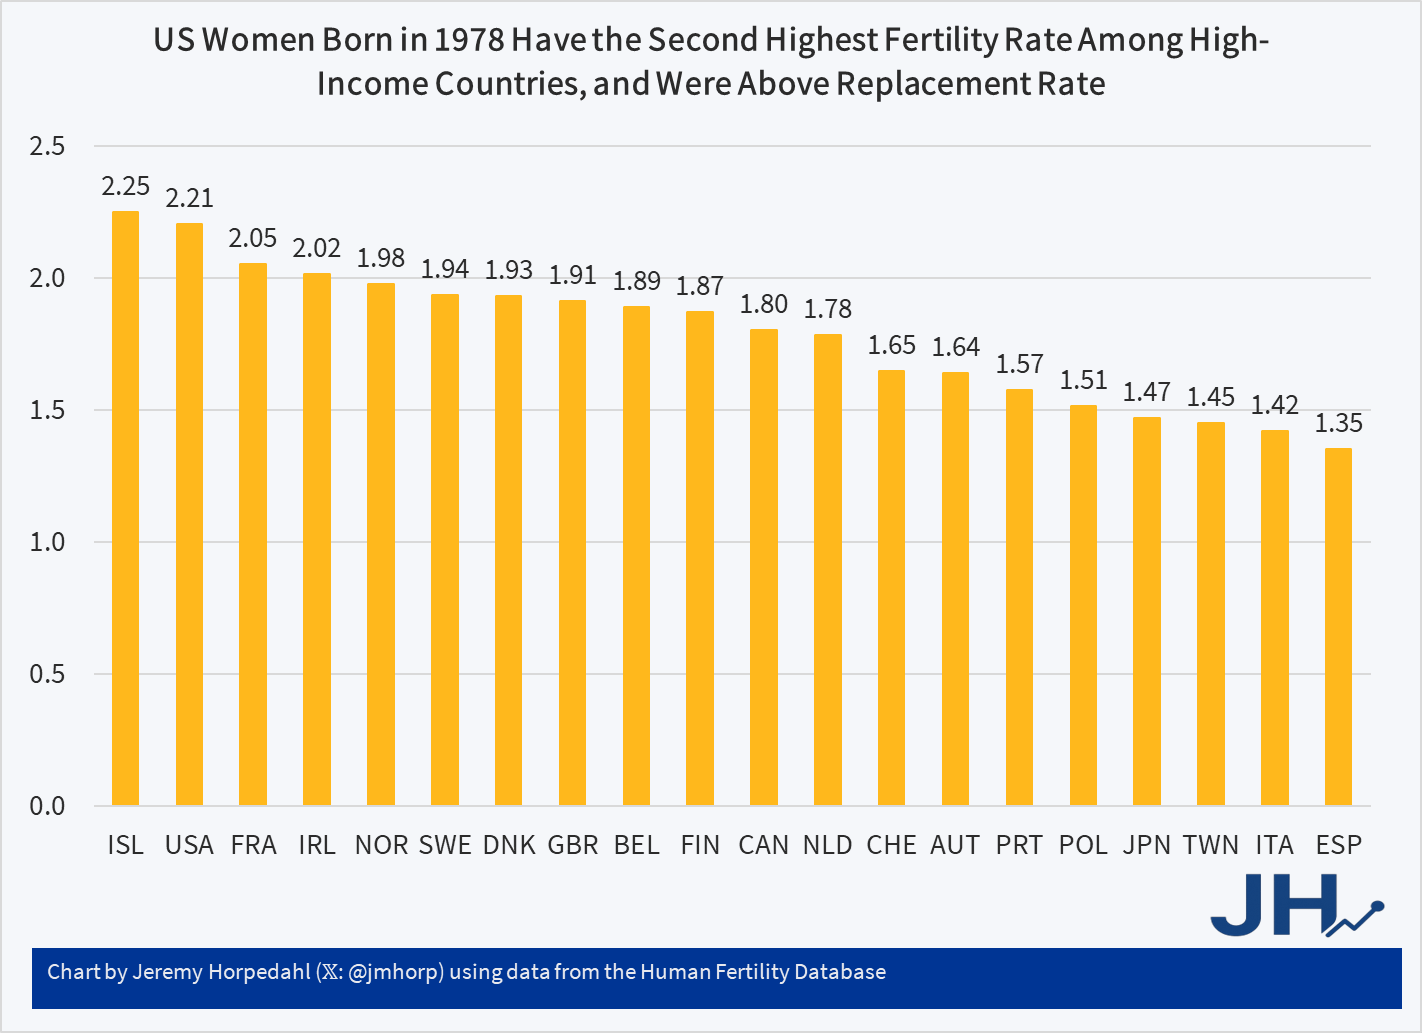
For women born in 1978, only tiny Iceland is higher than the US, and not by much. Countries like Spain, Italy, Taiwan, and Japan were already at very low fertility rates for the most recent generation to age out of child-bearing years. You have to go back to the 1974 birth year of women to get a much larger group of countries (28), but even then, the US and Iceland are clearly leading the pack. No other country is close among those in the HFD.
Of course, going back to 1974 or 1978 is a bit out of date for current debates. We want to know about young women who are now of child-bearing age. How does the US rank for later birth years?
If we look at women born in 1990, and go back to when this cohort was age 32 (they will be 36 in 2026, but using age 32 gets us a decent number of countries with data), here is what the ranking looks like:
Figure 2:
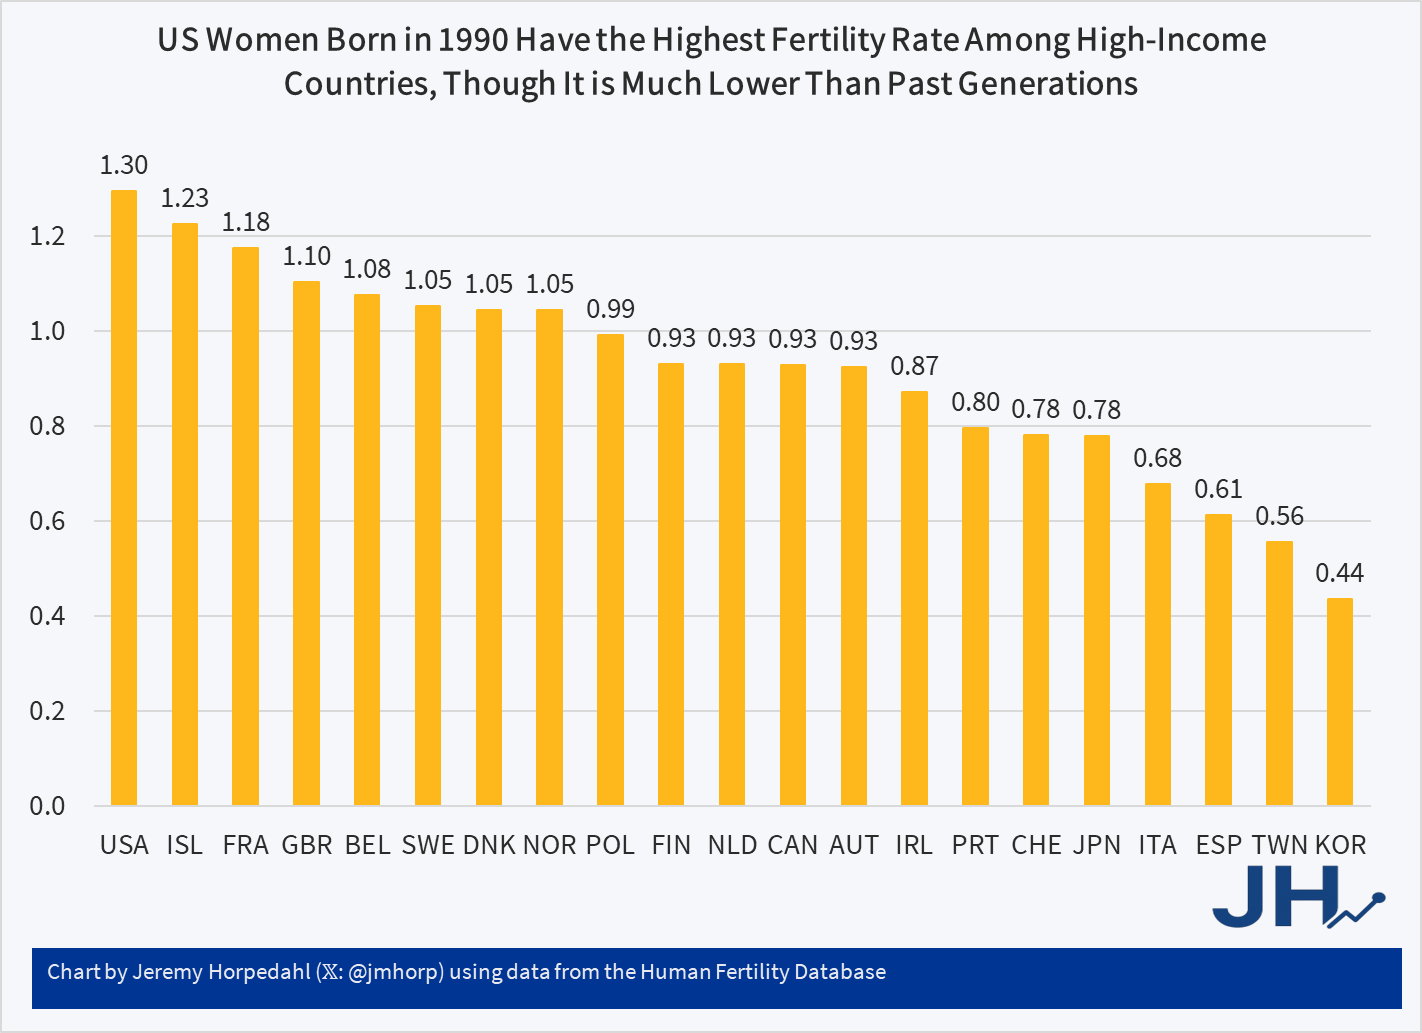
For women born in 1990, the US is now clearly at the top, even besting Iceland slightly. This may be cold comfort though, as if we look at women at age 32 in the US only and go back in time, 1.3 births are quite low: in the Baby Boom years, women had already had 2 children on average by age 32. For the 1955 through 1980 cohorts, women hadn’t had 2 children by age 32, but it was higher: about 1.6 births per woman at age 32.
All of those past cohorts ended up reaching the “replacement rate” level of 2.1 births per woman, even the 1980 cohort which isn’t quite fully through their child-bearing years. But younger women today are clearly delaying child-bearing, potentially delaying it in a way that will prevent the US from reaching replacement rates. Note: this hasn’t happened for any completed cohort yet! But it could. Is there any data we could use to look at this prospectively?
There is one measure which attempts to adjust the total fertility rate for changes in the timing of births. It is not a perfect prediction, but it is better to look at than the TFR in real time: the tempo-adjusted fertility rate. This measure does indeed show that the US fertility rate has been falling since about 2009-10, and that around 2017 it dipped below the replacement rate of 2.1 births per woman. In the most recent year available for the US (2022), it stands at 1.82 births, below the magic number of 2.1 births. Even so, the decline in the US of the adjusted TFR is not as dire as other countries. Using data for 2021, we can get a fairly large number of countries. Here is the ranking:
Figure 3:
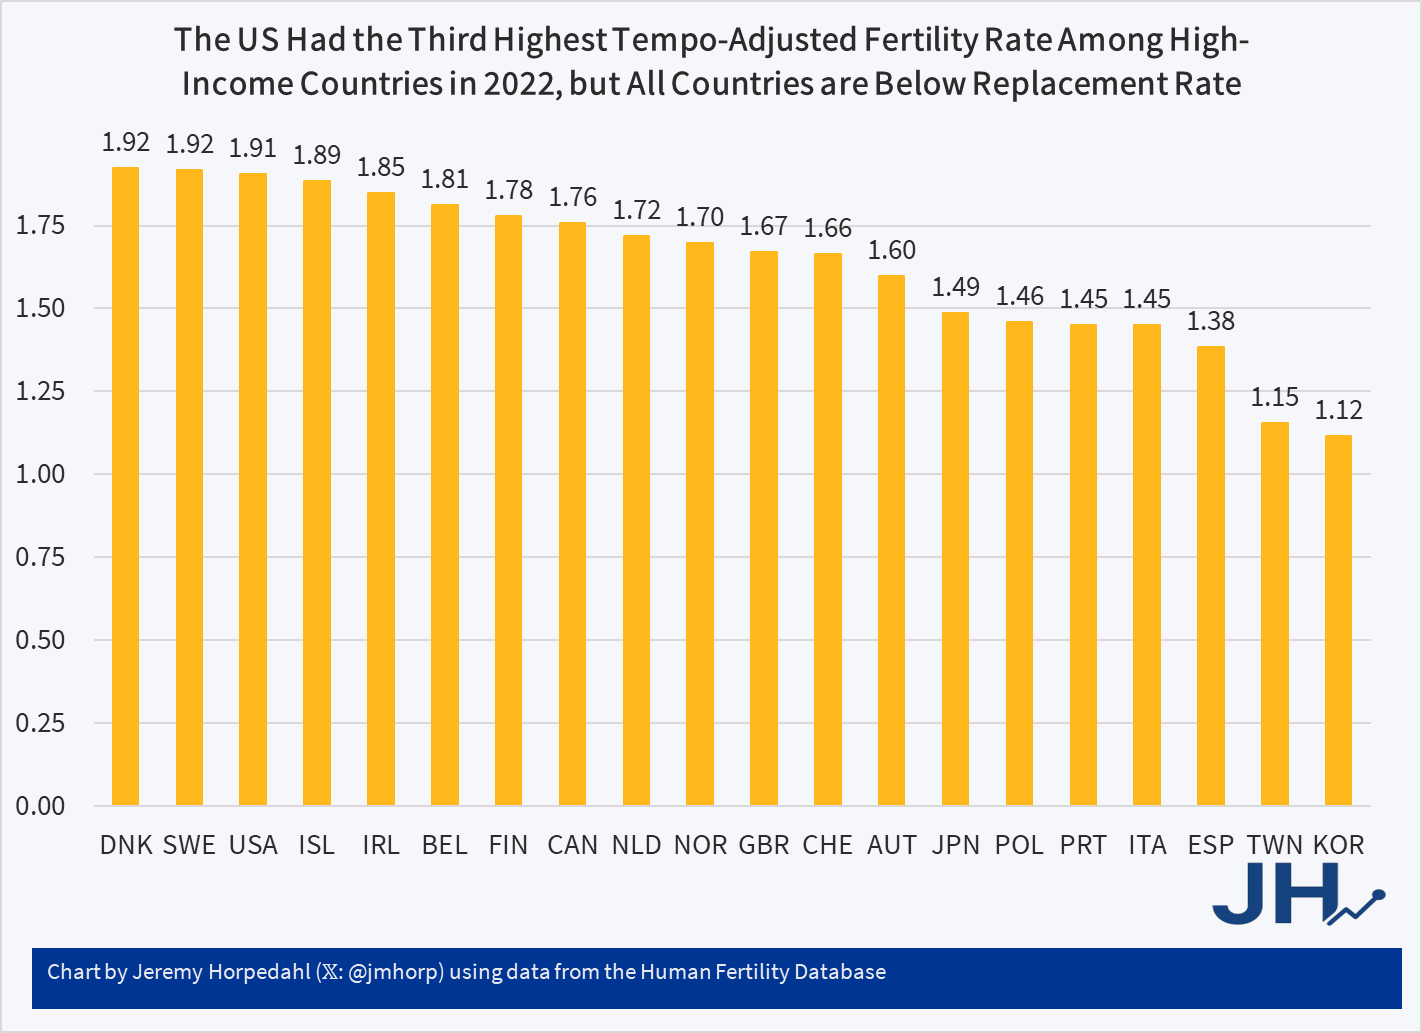
For 2021, the US has the third-highest tempo-adjusted fertility rate, though we are essentially tied with Denmark, Sweden, and Iceland. Every country in this group is below replacement rate, but it is quite clear the US and most of the Nordic countries are in a dramatically different position than South Korea and Taiwan, or even Southern Europe. Our younger generations of women may not quite get to replacement rate, but the effects on our population — at least for now — will be minimal over the next few generations.
Finally, one issue that often comes up when discussing birth rates in the US is how much of our high rates are driven by immigrants. The short answer is a little bit, but not entirely. Using data from the Current Population Survey’s Fertility and Marriage Supplement, we can see that in 2024 women ages 45-49 in the US (born in the late 1970s) had the following fertility rates:
- Native-born with native-born parents: 1.95 births per woman
- Native-born with at least one foreign-born parent: 2.03 births
- Foreign born: 2.13 births
Note that these figures are slightly lower overall than the 2.21 birth rate for 1978 in the US shown in Figure 1 above. Since this is a survey rather than the complete birth data, we wouldn’t expect it to be exactly the same. Nonetheless, it is true that only foreign-born women in the US had birth rates above the 2.1 replacement rate. But the differences aren’t that dramatic, and even native-born US women had birth rates that alone would put them among the highest in the developed world. So, it’s partially true, but not as dramatic as you might think.
But what of younger generations? Let’s look at women ages 30-34 in the US in 2024, who were born in the early 1990s:
- Native-born with native-born parents: 1.22 births per woman
- Native-born with at least one foreign-born parent: 1.02 births
- Foreign-born: 1.32 births
For this younger generation, the difference between native-born (with native-born parents) mothers and foreign-born mothers is even smaller. And at 1.22 births, the native-born women would be first in the world on their own, essentially tied with Iceland in Figure 2 (note: the “Native-born with at least one foreign-born parent” group is quite small, and if we group together all native-born mothers the rate is 1.19 births — I just separated it because people might ask).
Does the US face a falling birth rate? Yes. Is this as dramatic as most other countries? No. Will the US eventually get below replacement rate? Probably, but it’s not guaranteed and not by much in the short run. Is the US’s relatively better performance primarily driven by immigrant birth rates? Not really.

Great post, thanks for writing it up. But surely in the graphs “ISL” refers to Israel, not Iceland?
LikeLike
No, Israel is ISR in most data sets. But we don’t have Israel in this particular data.
LikeLike
Iceland is spelled Ísland in their language, similar to Spain’s abbreviation being ESP and Germany is DEU.
LikeLike
Mea culpa. I see that the Icelanders spell their country’s name “Ísland.” You learn something new every day.
LikeLike
For all our flaws, the US is a rich country and in that sense at least we are aspirational. Maybe people in the US are more likely to feel like they can afford the new basics for two children. If that includes braces, sports fees, school fees, electronics, etc. the it might seem unaffordable to have kids in lower income countries.
LikeLike