A reporter recently told me she thought there is a national trend toward hospitals issuing more bonds. I tried to verify this and found it surprising hard to do with publicly available data. But once I had to spend an hour digging through private Compustat data to find the answer, I figured I should share some results. Here’s the average debt in millions of companies by sector:

This shows that health care is actually the least-indebted sector, and telecommunications the most indebted, followed by utilities and “other” (a broad category that actually covers most firms in the Fama-French 10). But are health care firms really more conservative about debt, or are they just smaller? Let’s scale the debt by showing it as a share of revenue:
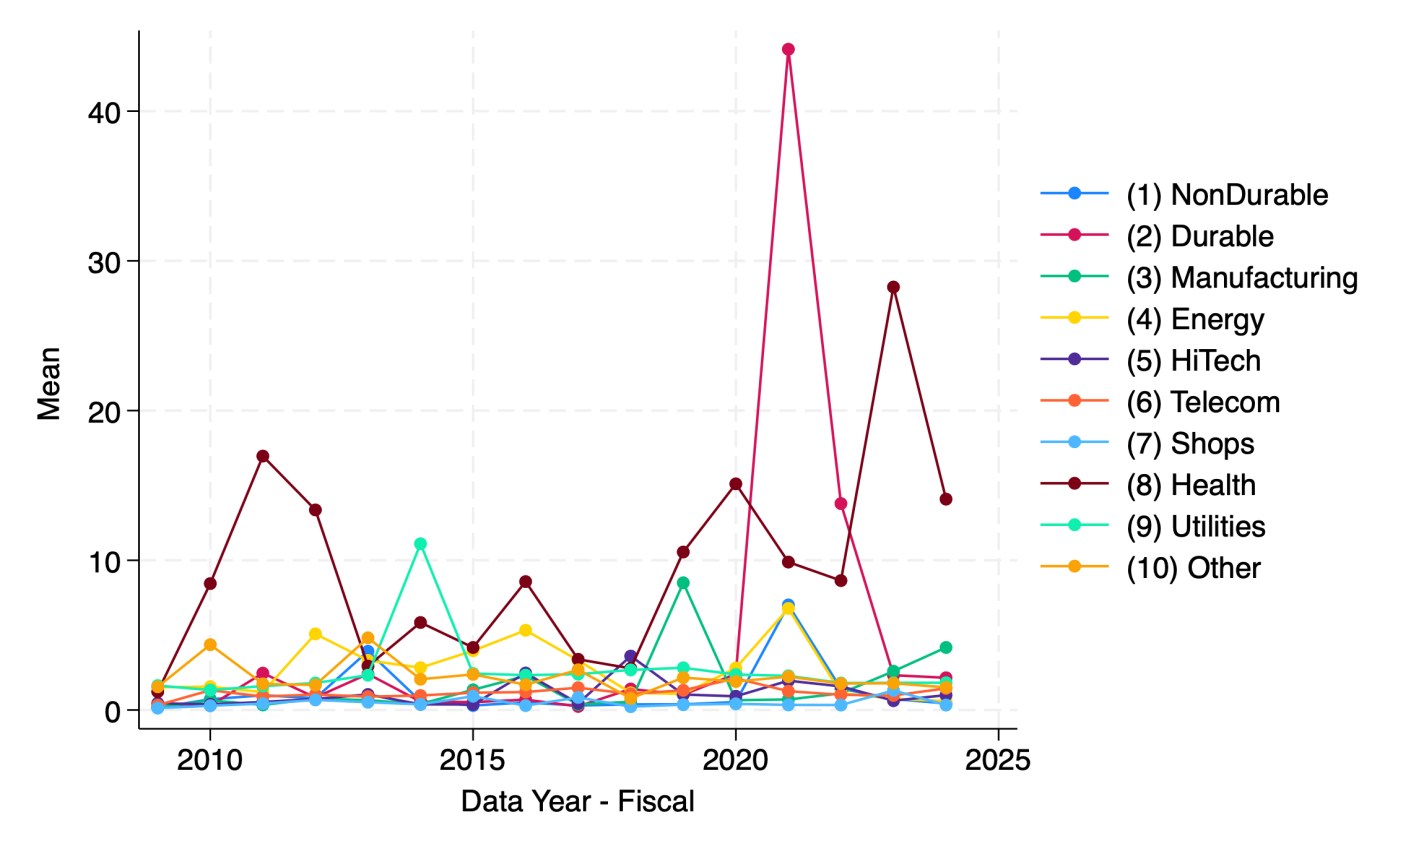
It appears that health care firms are the most indebted relative to revenue since 2023. But which parts of health care are driving this?
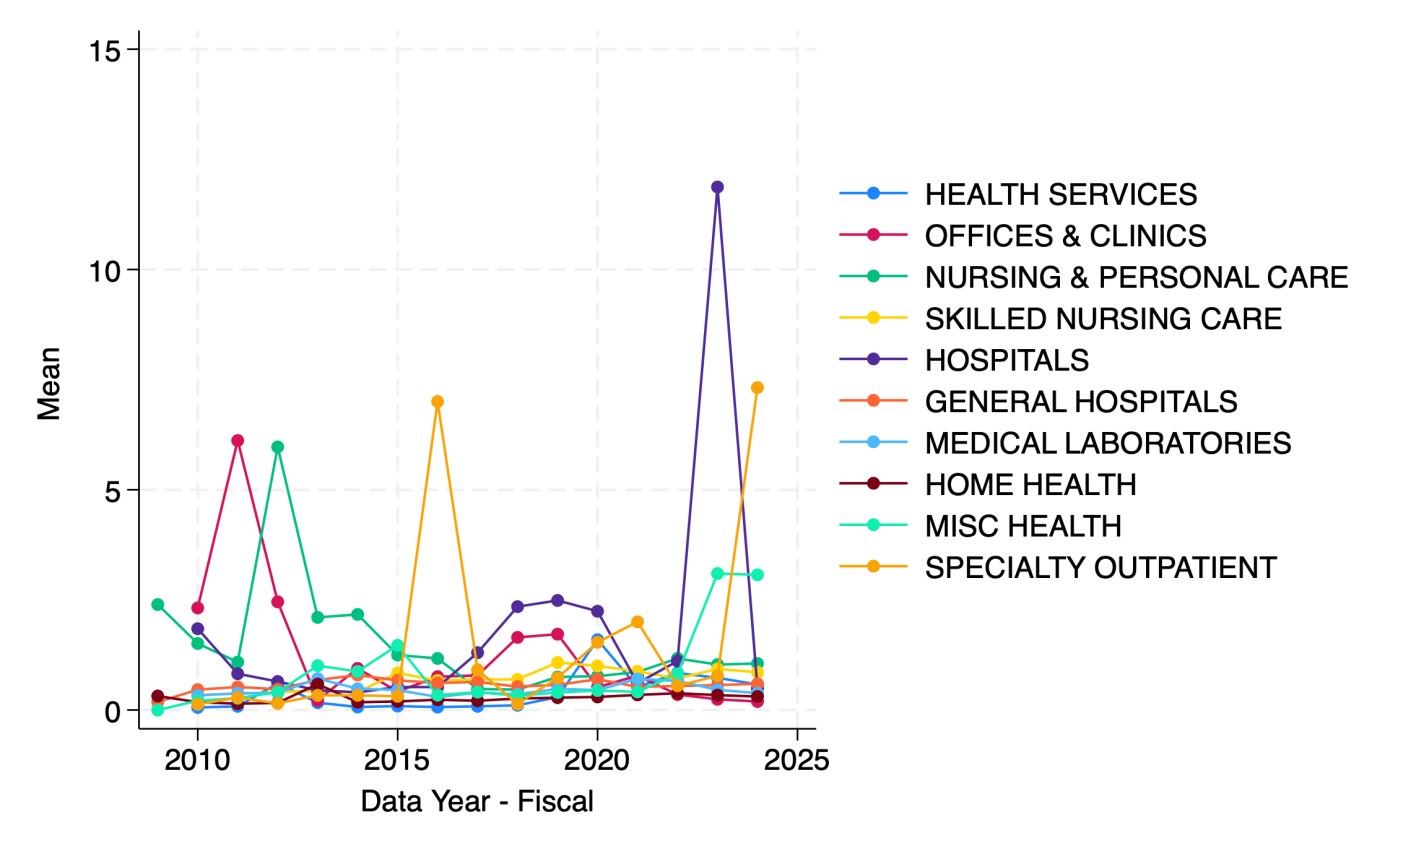
Hospitals in 2023 followed by specialty outpatient in 2024. However, seeing how much the numbers bounce around from year to year, I suspect they are driven by small numbers of outlier firms. This could be because Compustat North America data only covers publicly traded firms, but many sectors of health care are dominated by private corporations or non-profits.
I welcome suggestions for datasets on the bond-market side of things that are able to do industry splits including private companies, or suggestions for other breakdowns you’d like to see me do with Compustat.
