This post illustrates a couple of things that I learned this year with an application in finance. I learned about the simplex when I was researching amino acids. I learned some nitty-gritty about portfolio theory. These combined with my pre-existing knowledge about game theory and mixed strategy solutions.
Specifically, I learned a way of visualizing all possible portfolio returns. This post narrowly focuses on 3 so that I can draw a picture. But the idea generalizes to many assets.
Say that I can choose to hold some combination of 3 assets (A, B, & C), each with unique returns of 0%, 20%, and 10%. Obviously, I can maximize my portfolio return by investing all of my value in asset B. But, of course, we rarely know our returns ex ante. So, we take a shot and create the portfolio reflected in the below table. Our ex post performance turns out to be a return of 15%.
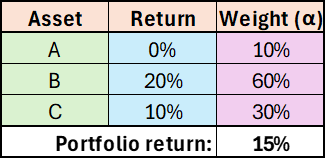
That’s great! We feel good and successful. We clearly know what we’re doing and we’re ripe to take on the world of global finance. Hopefully, you suspect that something is amiss. It can’t be this straightforward. And it isn’t. At the very least, we need to know not just what our return was, but also what it could have been. Famously, a monkey throwing darts can choose stocks well. So, how did our portfolio perform relative to the luck of a random draw? Let’s ignore volatility or assume that it’s uncorrelated and equal among the assets.
Visualizing Success with Two Assets
Say that we had only invested in assets A and B. We can visualize the weights and returns easily. The more weight we place on asset A, the closer our return would have been to zero. The more weight that we place on asset B, the closer our return would have been to 20%.
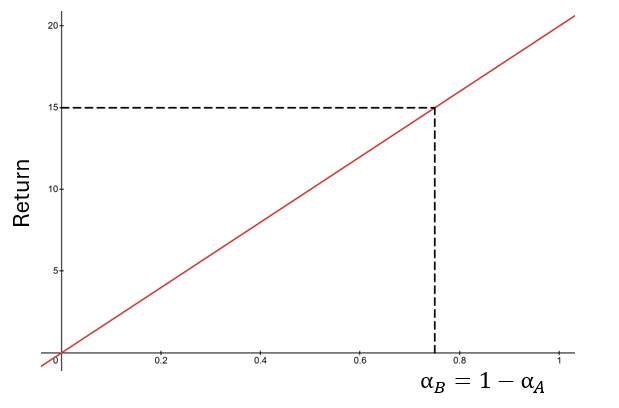
If we had invested 75% of our value in asset B and 25% in A, then we would have achieved the same return of 15%. In this two-asset case, it is clear to see that a return of 15% is better than the return earned by 75% of the possible portfolios. After all, possible weights are measures on the x-axis line, and the leftward 75% of that line would have earned lower returns. Another way of saying the same thing is: “Choosing randomly, there was only a 25% that we could have earned a return greater than 15%.”
