UPDATE: see also this post on homeowners versus renters, which givens important context to this post.
Are Americans spending more of their income on housing than in the past? Using data from the Consumer Expenditure Survey back to 1984, the answer is pretty clear: no. In fact, it has declined mildly.
This concern is usually raised on the context of young people. Are young people spending more of their income on housing than in the past? No.
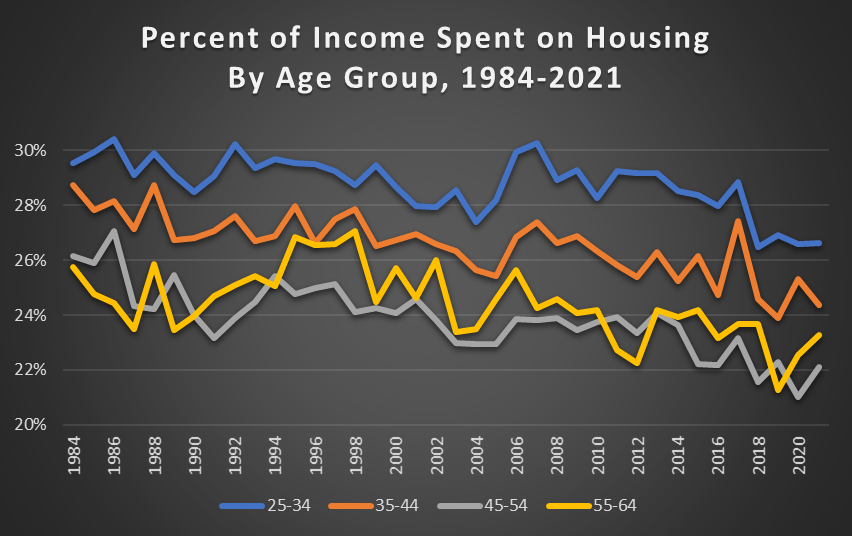
For working-age Americans, the percent of their income spent on housing has declined mildly since 1984, but I think it’s accurate to say it’s pretty stable (I have truncated the y-axis so you can see the detail). It’s true that young people spend more of their income on housing than older people, but this has always been true, and the gap is pretty constant.
Note: housing in the CEX data includes not only mortgage and rent payments, but also utilities, appliances, furniture, etc. There is a subcomponent called “shelter” which only includes mortgage or rent, which I show below. The trends are virtually identical, even though the levels are lower (about half). Throughout this post I’ll use the broader “housing” category but using “shelter” would give basically the same picture (though there is less of a decline).

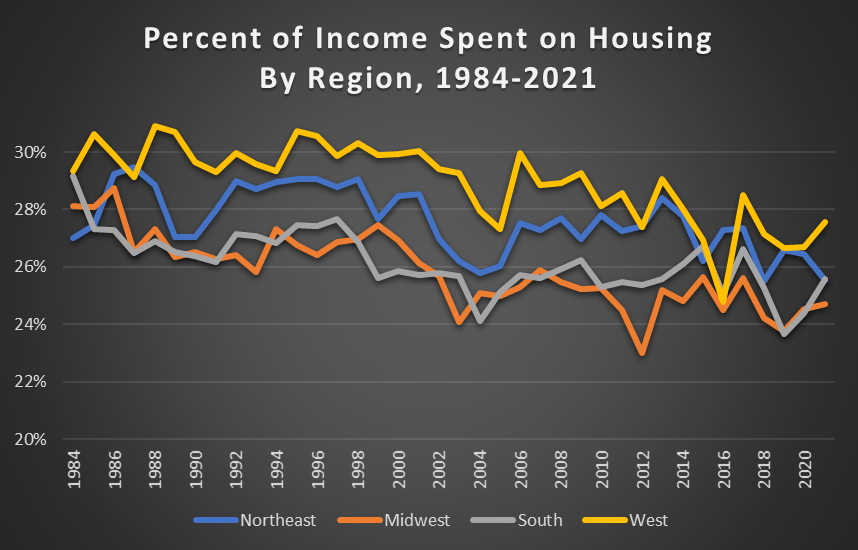
But perhaps these trends only affect Americans in certain regions of the country, such as the West and Northeast. Nope. Remarkably stable over time (again, slightly down). The West and Northeast do spent slightly more of their income on housing, but not much more, and these gaps don’t seem to be changing over time.
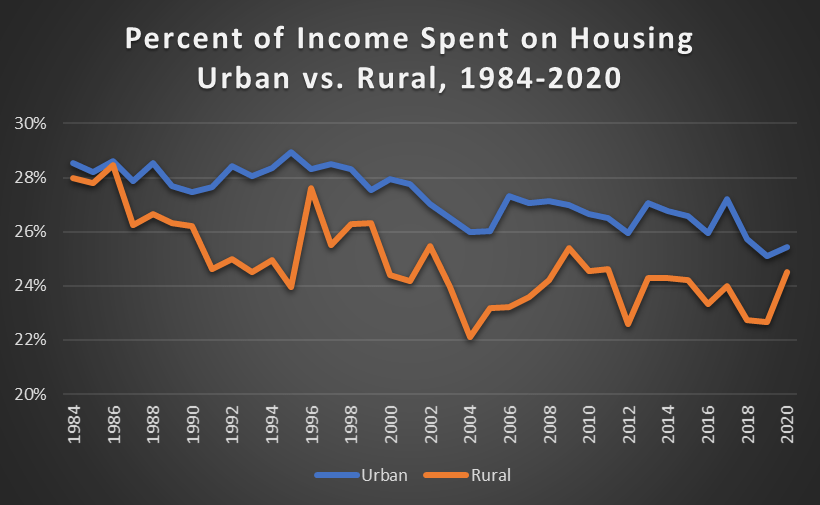
OK, maybe it’s not a regional thing, maybe it’s urban versus rural. Are urban areas seeing more income go to housing? CEX has data on this as well. Once again, a big nope. (Note: this data stops in 2020, when CEX changed the urban/rural classifications).
On the other hand, I am certain if you drilled down to a very specific level of detail, say, college grads 25-34 living in San Francisco, you could see some different trends. CEX has micro-data where you could try to do this, but I imagine the sample size would get too small for it to be useful once you start doing all that slicing. Still, I imagine that it is probably true. There are definitely a few city (San Fran, LA, Seattle, NYC) where land-use restrictions are really starting to bite. And over the next few years, I do worry that this could be a problem in more and more cities.
But so far (and crucially for the period when millennials have been trying to buy houses) Americans have continued to spend about the same fraction of their income on housing as have past generations.
The final objection to this pattern could go as follows: but shouldn’t these be falling a lot over time?!? Isn’t that the definition of rising standards of living? Maybe, maybe not. For many consumer goods, we might expect this to happen, but I don’t think we should expect big declines on housing spending. First, you have to spend your income on something. Second, people are getting bigger and (by most standards) better quality housing than in the past.
Third, people do, rightly or wrongly, think of housing as a form of investment. When you apply for a mortgage, the bank will often tell you how much you can “afford” based on your income. I suspect for a lot of buyers, this serves as an anchor for the price of housing they shop for. Perhaps that’s not a wise financial decision, but it’s probably a common one.
People just seem to spend 25-30% of their income on housing (with about half of that going to “shelter”). And this seems to be true as far back as we have data: in 1901, Americans spent on average 24% of their income on housing. That’s slightly below what we spend now, but this has been pretty consistent over time, with notable exception of the Depression. Truncating the y-axis really distorts the picture here: this is consistently within a band of 22-28%. The 1950s through the 1970s do seem a bit more “affordable” than today, but since the 1980s there has been no big increase (once again, a mild decline).

Thankfully, since the cost of food and clothing has indeed declined, Americans spend much less of their income on food, clothing, and housing combined than we did a century ago. Some of those savings from food and clothing went to new goods and services, but no doubt some of it went to nicer and bigger housing too.
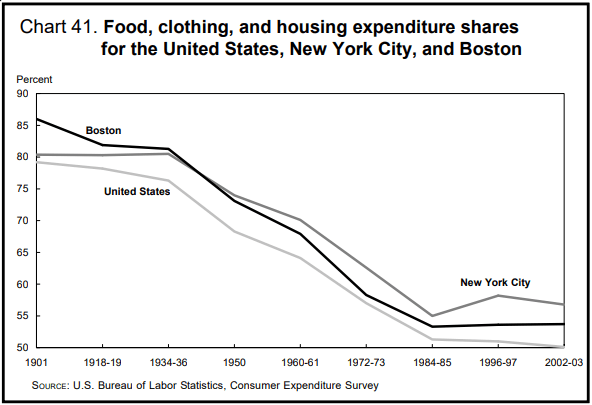
To really see how stable spending housing is, it’s useful to compare it to something that has declined. Food is a good example, which has declined dramatically as a share of income (even as we eat better food and dine out more). Until the 1960s, Americans spent more on food than on housing!


Interesting article. Well researched and you thought through multiple aspects of the issue.
Did you look at applying a case mix adjustment to account for renters vs homeowners? I’d guess that there were fewer renters in the 1980s for the 25 to 34 bucket. The relatively low % of income spent on housing today may be because there are more renters which is less expensive than home ownership.
I agree that young people are spending a relatively similar amount of their income on housing as in the past, but for the same %, they’re getting a lot less housing.
LikeLike
The analysis is wrong because you included healthcare as income. In reality healthcare and other fake income inflates the personal income measure and actual housing percent income went from 30% to 50% or so over the period.
The personal savings rate is at historical lows and the sub-5% values since 2020 reflect functionally no savings with the economy kept alive by forebearance and other gimmicks.
LikeLike
I’m curious about where you sourced your data. I’m not an economist, but this doesn’t correspond to what I’ve seen elsewhere. From what I can tell, housing costs have risen from ~20% of median income to ~30% of median income. This is based on both what I’ve read elsewhere and on my own cursory read of the delta in income and housing costs over time.
I don’t say this to create a gotcha, I’m sincerely curious about your methodology. I’m not an economist, and I want to understand how the housing market is shifting. I would genuinely appreciate your helping me to understand how you arrived at your conclusion.
LikeLike
I’m curious about your methodology. From what I can tell, both from other authors and from a look at median home costs and median income over time, housing costs have increased from 20% to 30% of income. However, I am not an economist. This isn’t a gotcha, I would earnestly like to understand your methodology and how you arrived at your conclusion.
LikeLike
This analysis fails to acknowledge an important transition that also happened in the same time period: the movement from 15 year mortgages to 30 year mortgages. People are still spending 25% of their annual income on housing, sure—but it pays for 1/30th of a house instead of paying for 1/15th of a house.
The average cost of a house has increased from 2-3x median income to 5-6x median income. That’s a fact.
LikeLike