A few months ago I looked at the richest and poorest MSAs in the US, including adjusting for the cost of living in each MSA. One big thing I found was that the list doesn’t change that much when you adjust for the cost of living: San Jose, San Francisco, Bridgeport (CT), Boston, and Seattle are still the highest income MSAs even after accounting for the fact that they are also high-cost-of-living places to live. The gap shrinks, but they are still in the lead.
But that was adjusting for all the factors in the cost of living. But what if we just looked at one important aspect of the cost of living: housing. And since the cost-of-living adjustments (BEA’s RPP) that I was using are from 2021, what if we tried to bring the data up as close to the present as possible? We know that housing prices have increased a lot since 2021, but also that the cost of borrowing has risen dramatically too. What would this show us about the cost of living for different MSAs?
A tool from the Harvard Joint Center for Housing Studies allows us to make some pretty up-to-date comparisons. Their interactive map shows data for the 179 largest MSAs (about half of the total MSAs in the US) on the median price of each home for the second quarter of 2023 and uses interest rates from that quarter to show the rough principal and interest cost (assuming a 3.5% down payment). Taxes and insurance costs for each MSA are also estimated.
Based on those assumptions, their tool provides the minimum income you would need to purchase a home in that area, assuming a 31% debt-to-income ratio for the mortgage. And the income levels needed vary quite widely across MSAs, from a low of $44,000 in Cumberland, Maryland, to a high of over $500,000 in San Jose, CA. That’s a huge difference.
Of course, we know that incomes also vary across MSAs. But they don’t vary that much. The JCHS tool doesn’t provide this data (though a JCHS map from 2017 did compare house prices to incomes), but we can look up median family income for each MSA from Census. Doing so we see that San Jose is indeed unaffordable based on the current (2022) median income, which is “only” about $170,000. A nice income compared to the national median, but only about 1/3 of the $500,000 you would need to afford a home in San Jose. Cumberland looks much better though: median family income is over $77,000 there, about 76% more than you would need to buy a home!
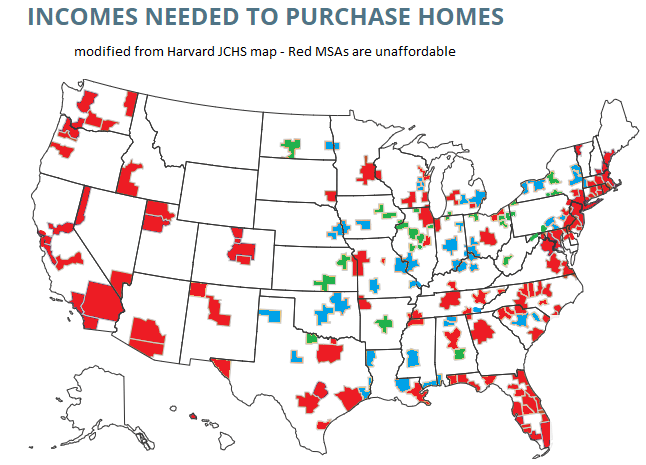
What if we did a similar calculation for all MSAs in the JCHS data? The following map is my attempt to do so. Sorry, but my graphics skills are not the best, so this map isn’t as pretty as it could be (I started with the JCHS map, and just shaded in the colors I wanted to use). But I think it conveys the general idea.
Green-shaded MSAs are the most affordable: places like Cumberland, Maryland, where median family income is well above (at least 20% above, my arbitrary threshold) the amount JCHS says you need to buy a home. There are 27 Green-shaded MSAs. Blue-shaded MSAs are affordable too, and median income is between 100% and 120% of the amount needed to afford a home on the JCHS standard. There are 41 of these, making 68 total MSAs out of these 179 that are affordable. Red-shaded MSAs are less than 100%, and thus unaffordable (though as I will discuss below, some are much closer to affordable than others).
To be clear, there is some endogeneity here. People will tend to locate in areas where they can afford homes. And if people with higher earning power move to currently “cheap” areas, their additional demand will boost housing prices and these differences in affordability will be reduced. Still, given all that, this map and the divergence in housing affordability is perhaps even more surprising. Some places of the country are actually really affordable relative to income. The MSAs of central Illinois (places like Peoria, Decatur, and Springfield) are very affordable, with the median home only costing about twice median family income. Three times median income is a general good rule of thumb, and basically all of the Green and Blue MSAs meet this criteria or are much better at the median.
But some places are really unaffordable, some of which you might expect, like the major MSAs of coastal California, where house prices are 8-10 times median incomes. But it’s not just coastal California or the coast Northeast US, notice it is also all of Florida, most of Texas, and basically everywhere west of the Great Plains/Oklahoma (there are probably some affordable MSAs in Wyoming or Montana or rural Idaho, but they are not among the top half of MSAs by population). Heck, even all of North Carolina and most of South Carolina and Tennessee is now unaffordable for new home buyers.
Some of the red-shaded MSAs are actually pretty close. Fairly large MSAs like Kansas City, Minneapolis, and Philadelphia are within 95% of the income JCHS says you would need to afford a home. And the incomes here are from 2022, so perhaps in 2023 (where the price data comes from) they are inching up to 100% of affordability. But even at the 100% threshold, the median home is just barely affordable to the median family. It’s still not a situation to celebrate. And a lot of places that used to be affordable, like Northwest Arkansas, Raleigh (NC), or Milwaukee, no longer come anywhere near to that 95% threshold, and home prices in these MSAs are now 4 times median income or higher.
And while the affordable MSAs do tend to be smaller, some large MSAs are affordable or close to it. The largest MSA that falls into the affordable category is Detroit, the 14th largest MSA with over 4 million people, where the median home is roughly 3 times median family income. St. Louis is the 21st largest MSA with just under 3 million people, and also falls into the affordable group with median home prices slightly under the 3x family income threshold. And while Detroit and St. Louis may seem like bad examples given the depopulation their central cities have experienced over the second half of the 20th century, their respective MSA are the largest or very close to the largest they have ever been.
There are still places where you can buy an affordable home in the US. The trouble is that the number of places is shrinking over time, and the housing affordability issues that used to be concentrated in places like San Francisco, New York, or Miami are increasingly spreading across the country, both as people move to currently cheaper MSAs and as the binding constraints of land-use policies increasingly start to be binding constraints throughout the US.

2 thoughts on “Where Can You Still Buy an Affordable Home in the US?”