Last time the gifs were simply about price & quantity and welfare. I’m sharing some more GIFs, this time in regard to welfare and taxes.
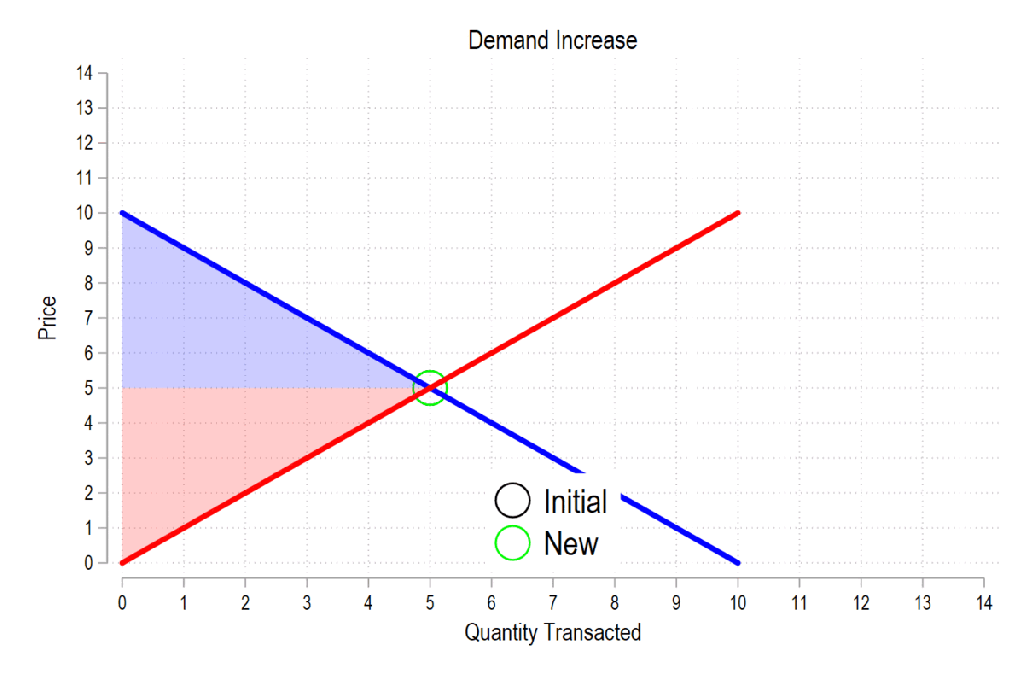
First, see the below gif. It shows us that both consumer surplus (blue area) and producer surplus (red area) always rise if there is a demand increase (assuming the law of supply and law of demand).
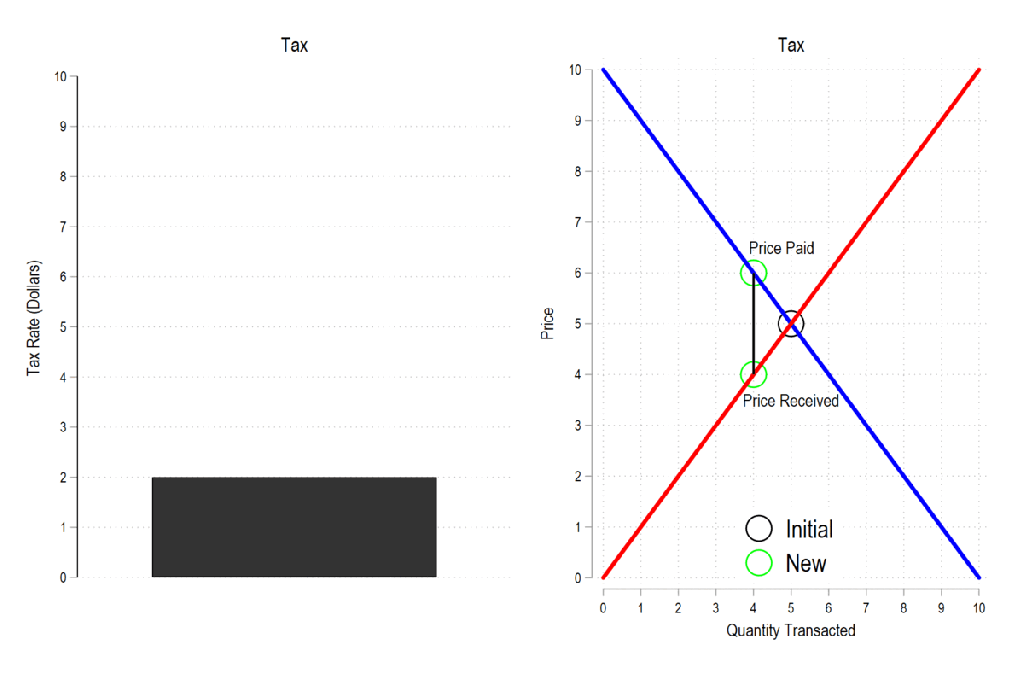
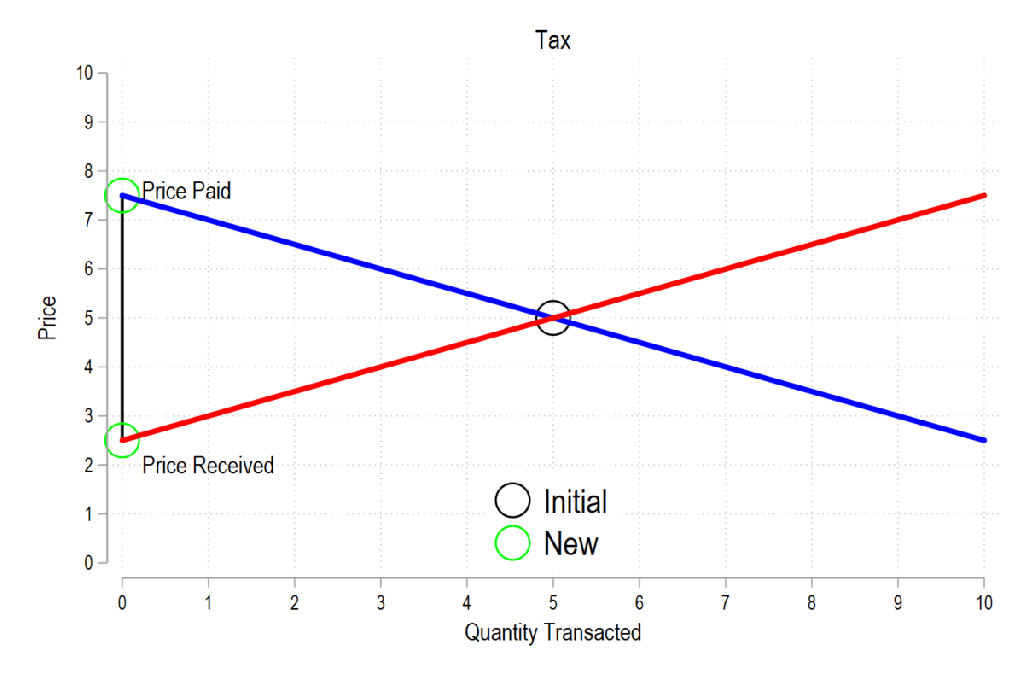
Next, let’s consider a basic tax. We can represent it as the difference between what the demander pays and what the supplier receives. The bigger the tax, the bigger the difference between the two.
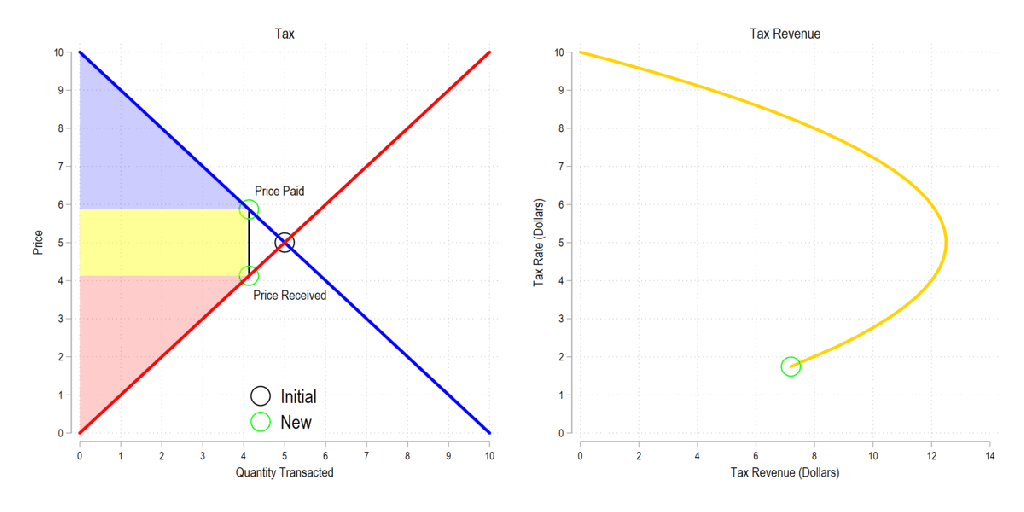
Now let’s combine the tow ideas: If taxes rise, then the quantity transacted falls, price paid rises, price received falls, and both consumer and producer surplus fall. Not only that, since there is an inverse relationship between the tax rate and the quantity transacted, it may be that increasing the tax rate more *reduces* revenue. The idea that there is a tax revenue maximizing tax rate is illustrated below right and is known as the Laffer curve.
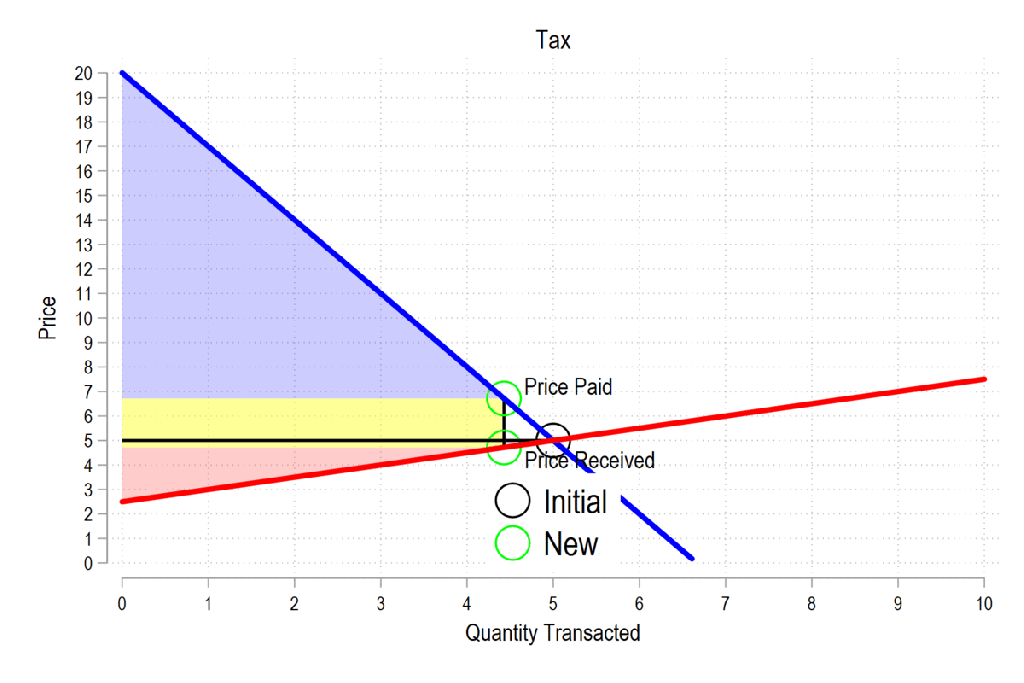
The above images seem to imply that the welfare loss is equally shared by suppliers and demanders. But that’s not always the case. For both suppliers and demanders, if alternatives to a taxed good are more available, then the curve is flatter; and if alternatives are relatively limited, then the curve is steeper. Sensibly, someone who has alternatives will be able to avoid much of the tax and their welfare will experience a smaller impact.
Finally, taxes can be serve two purposes: 1) They can be a deterrence to reduce the quantity transacted, and 2) they can be extractive to raise revenue. Below, the tax rate is constant. If suppliers and demanders have alternatives and flatter curves, then they will more readily switch to some other good or activity when they are taxed, reducing the quantity transacted and the tax revenue. However, if suppliers and demanders have few alternatives, then taxes have a smaller impact on the quantity transacted and a larger impact on tax revenue. In other words, the goals of raising revenue and deterring activity are at odds.
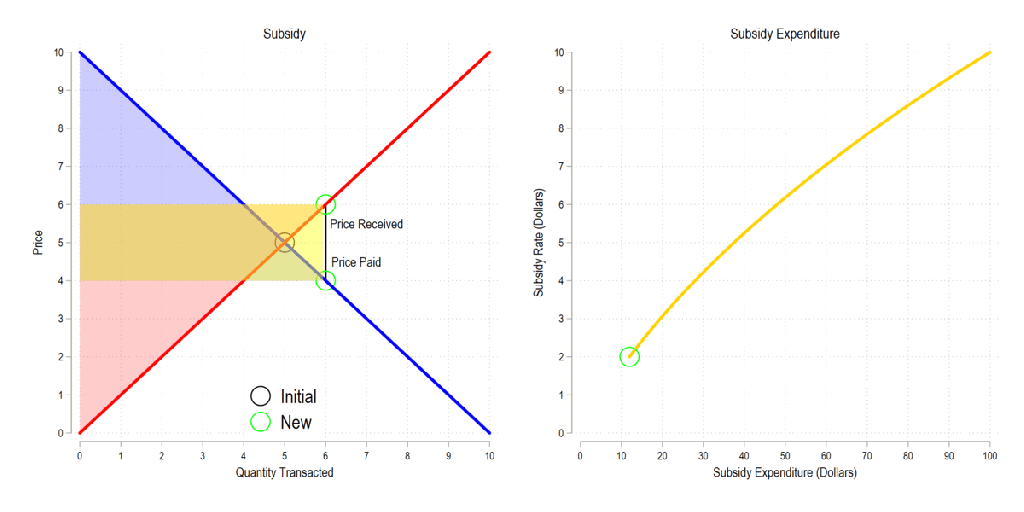
Finally, let’s talk subsidies. Subsidies make both the market’s suppliers and demanders better off. But, subsidies also cause transactions to occur where the marginal cost is greater than the marginal benefit – destroying value. Further, as the subsidy rate increases linearly, the government subsidy expenditure increases quadratically – increasing the burden of the subsidy.
I dream of a future where people post graphical gifs as part of their online arguments. Enjoy!

I love this, and recently taught in to my Intro Macro class, so I’m going to share it with my class.
One more step would be helpful. Can we show the change in dead weight loss relative to tax rate in concert with the Laffer curve?
Similarly, we can show the waste from a subsidy in concert with subsidy expenditure.
LikeLike