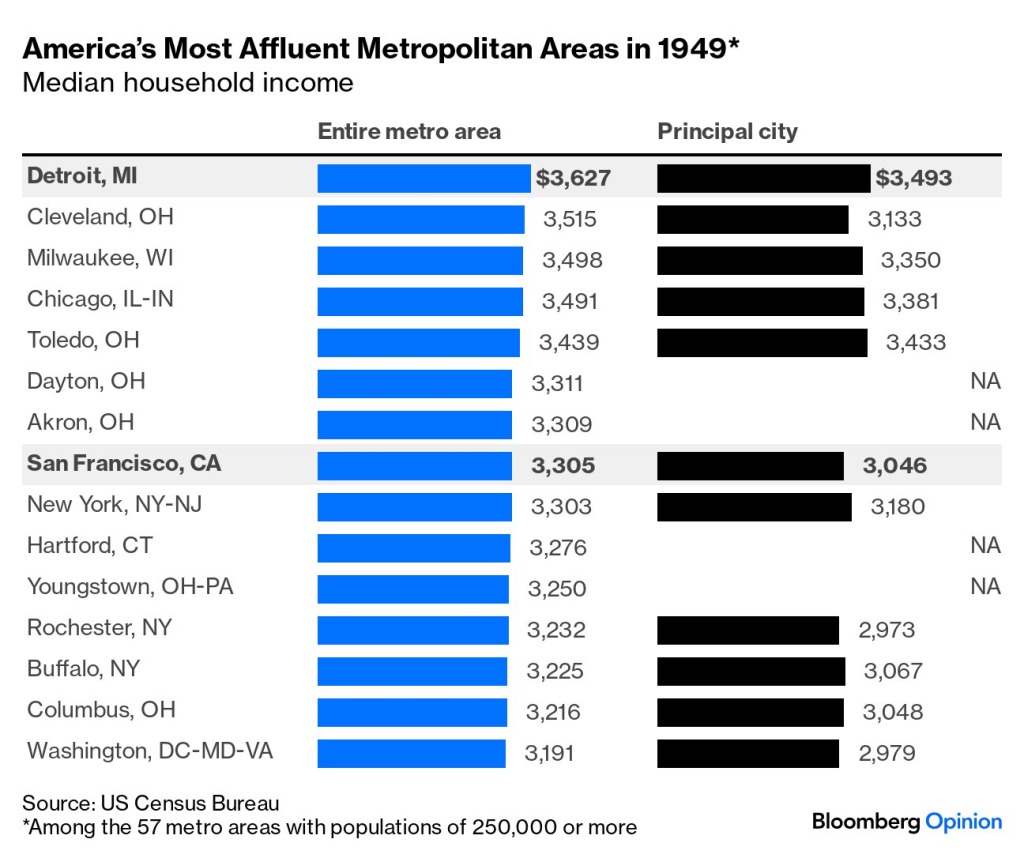
Lately on Twitter this chart has been going around:

The chart comes from Bloomberg journalist Justin Fox, who always puts together interesting economic data. You can read his interpretation of the data at Bloomberg, but the folks posting it on Twitter all seem to have the same shock and awe: Detroit was the richest big city in 1949. And of course we all know that today it isn’t. Still, the Detroit MSA has done OK since 1949, even though it is no longer anywhere near the top.
How well has Detroit done? Despite industrial decline and many other major problems, median household income of the Detroit MSA was around $71,000 in 2022 according to the Census Bureau. How does this compare to the $3,627 median income in 1949? It’s about double in real terms: you can multiply it by about 10 using the Census’ preferred inflation adjustment for household incomes since 1949 (the C-CPI-U since 2000, and the R-CPI-U-RS before that).
Is a doubling in 73 years a good outcome?
In a broad sense, I would say no. Real median household income for the entire US tripled since 1949, so a doubling doesn’t sound so great. And in places like San Francisco (not the highest in 1949, but near the top), median household income nearly quadrupled in real terms.
Also, the Detroit MSA has a roughly equal median household income to the Miami MSA in 2022. This fact is, perhaps, almost as shocking as the 1949 statistic. When you think Miami, you probably think gleaming new skyscrapers, beautiful beach communities, etc. Detroit is decaying factories, abandoned homes, etc. But they both have about $71,000 median household incomes.
A few caveats here. First, I have been talking about MSAs. The central city of Detroit has performed terribly since 1949: median household income today for the city of Detroit is $36,000, almost exactly what it was in 1949 (inflation adjusted — remember, multiply by 10). Ouch!
Second, I haven’t done any cost-of-living adjustments. The Detroit MSA is about 96% of the national average, using BEA’s RPP, while San Francisco MSA is 118% of the national average. Still, the gap between them is large. But note that the Miami MSA is much closer to San Franciso at 111.5% of the national average (if you think these differences aren’t great enough, that’s because you are probably just thinking of housing costs, not all costs — on housing costs, SF is 206% of the national average, and Detroit is 94%). So on a cost-of-living adjusted basis, Detroit MSA’s median income is higher than Miami!