I’ve written before about how we can afford about 50% more consumption now that we could in 1990. But it’s not all bread and circuses. We can also afford more capital. In fact, adding to our capital stock helps us produce the abundant consumption that we enjoy today. In order to explore this idea I’m using the BEA Saving and Investment accounts. The population data is from FRED.
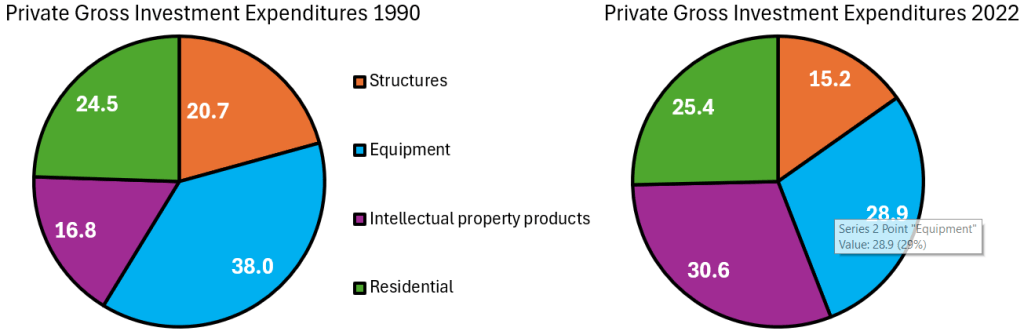
The tricky thing about investment spending is that we need to differentiate between gross investment and net investment. Gross investment includes spending on the maintenance of current capital. Net investment is the change in the capital stock after depreciation – it’s investment in additional capital not just new capital. Below are two pie charts that illustrate how the composition of our *gross investment* spending has changed over the past 30 years. Residential investment costs us about the same proportion of our investment budget as it did historically. A smaller proportion of our investment budget is going toward commercial structures and equipment (I’ve omitted the change in inventories). The big mover is the proportion of our investment that goes toward intellectual property, which has almost doubled.
It’s easiest for us to think about the quantities of investment that we can afford in 2022 as a proportion of 1990. Below are the inflation-adjusted quantities of investment per capita. On a per-person basis, we invest more in all capital types in 2022 than we did in 1990. Intellectual property investment has risen more than 600% over the past 30 years. The investment that produces the most value has moved toward digital products, including software. We also invest 250% more in equipment per person than we did in 1990. The average worker has far more productive tools at their disposal – both physical and digital. Overall real private investment is 3.5 times higher than it was 30 years ago.

However, real investment in structures is nearly flat and residential investment is up only 17%. What gives? There are a couple of hypotheses. Maybe our equipment and software occupy less space and we need smaller and fewer structures. A couple of computers can replace rows and rows of cubicles if we augment them with a couple of employees. Also note that Covid-19 caused a decrease in real investment in structures. But it wasn’t dramatic and it was oscillating around zero throughout the timeseries.
A major concern with real gross investment is that it might just be replacing worn out capital. It may be that all of that spending is just replacing old parts that have depreciated and we don’t actually have any more capital per person than we did previously. Even if everything is new, it might just be shinier versions of the same-old-same-old. In terms of our productivity, we should really focus on our *net investment* – the investment after we’ve maintained the old capital. Another challenge concerns ‘negatives’. Investment is *far* more volatile than consumption. In some years we don’t even replace everything that depreciated – and we have outright negative net investment. Therefore, the below graph illustrates the historical net investment per capita as a proportion of the 1993 values (the first year in the sample with all positive values).

You can definitely see the volatility in annual net investment, but over the past 30 years we’ve had massive increases in the annual contributions to our capital stock. Overall, we contributed 110% more in 2022 than in 1993. Again, intellectual property leads the way with the US adding 460% more capital per person than we did 30 years ago. Clearly there are big structural changes happening in our economy.
Speaking of structures, our net structures investment per capita is down 22% compared to 1993 and it doesn’t look like it’s due only to the recent pandemic encouraging remote work. It’s been pretty lame throughout. The average net structure investment over the entire period has been 20% higher than in 1993, and it’s not exactly moving in an encouraging direction. However, as I said above, this is maybe due to us becoming more productive in less space.
A more concerning figure is net residential investment. Though the average house might be bigger, in every year since 2007 we’re getting less additional house per person. Our inflation-adjusted residential investment isn’t keeping up with the depreciation and population growth. There’s lots of theories. Maybe the relative price of physical buildings is higher now that we consume more digital goods. Maybe home owner’s associations and regulations are stifling access. Or, maybe people just migrated and the housing stock hasn’t caught up yet. Regardless, the overall picture is more evidence in the familiar story of scarce housing.
You might notice that the above graph omits real net equipment investment. The reason is that it threw off the vertical axis and made the graph difficult to read. I thought that maybe it was just due to the timeseries volatility and the particular base year that I chose. But that’s not the issue. Below is the real net equipment investment per capita data from FRED, entirely deserving of its own graph. Over the past 30 years we have lived through massive changes in the workplace that were nothing remotely like the prior 30 years. After 1990 we began contributing massively to additional equipment stock in the US. This graph is consistent with new computers and automating factories.

The tools that we interact with everyday are becoming better and more numerous in a way that our parents didn’t experience. When I hear older people say that life is changing faster than ever, I usually shrug it off and chalk it up to their wonder at digital technology. I’m wrong. The world and the workplace are not the same as they used to be. It’s not just that the new stuff is different. We’re filling our offices and industrial buildings with neat and productive new equipment year after year in a way that defies the 20th century.
