This post is quick and simple. We all know that states have different land areas and different populations. We also know that different states produce different amounts of output. We have a pretty good sense for which are the ‘big’ states since these things often go hand-in-hand. But what about household spending on consumption? It’s easy to imagine that some states produce plenty but then invest the proceeds. So, which states consume the most relative to their income?

The map above illustrates which states consume more of their income. There’s not much correlation geographically. But, among the ‘big’ states (Texas, California, New York, Illinois), the consumption per GDP is below the average of 67%. Can we make sense of this? As it turns, out more productive states also tend to have a higher per capita output. So, those higher GDP states also have richer populations on average. And, sensibly, those richer populations have lower marginal propensities to consume. They save more. But this is just spit-balling.
The big exception is Florida. It’s the 4th largest state by GDP, but has the 6th highest consumption-to-GDP ratio. We can tell stories here too. Maybe being older or retired results in more consumption for life cycle reasons. Except for bequests, older people are running out of time to consume. So, they consume at higher rates than other adults. In other words, they save less of their income. That’s sensible, but again it’s just a guess. Another explanation might be tourism dollars that get counted as consumption.
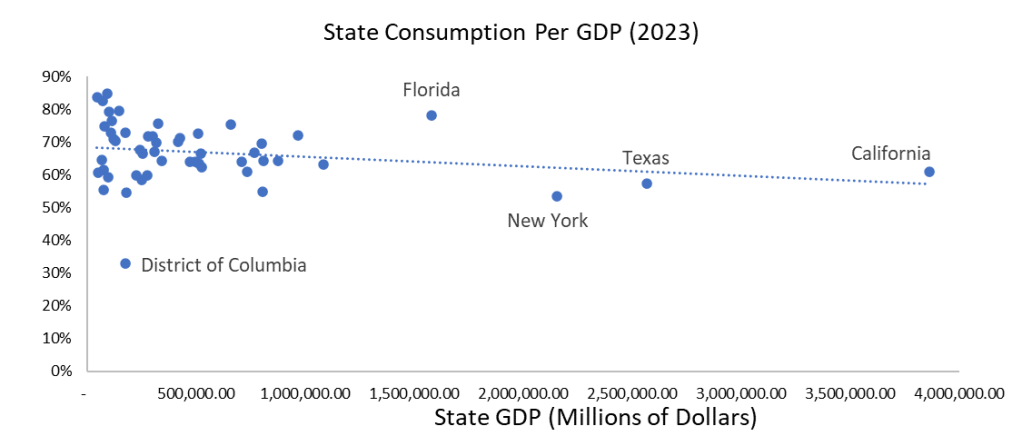
The above is a scatter plot of consumption-to-GDP ratios vs GDP. All else constant, dividing by GDP should produce a negative trend. But the same pattern appears if the horizontal axis is consumption or GDP per capita instead. Most of the states have a GDP near or below $100 billion and the pattern of higher output states consuming a lower proportion of income is relatively stable throughout the distribution. The above figure reveals that the District of Columbia is an outlier too. This is sensible. Maybe that’s people earning in DC and then spending elsewhere, say in nearby Virginia or Maryland. Alternatively, there is a lot of infrastructure and investment spending there, so that might similarly account for the low proportion of consumption.
Is a high rate of consumption a bad thing? No, not necessarily. In one sense it reflects less saving for the future. In another sense, higher consumption can be indicative of a prosperous past. You probably know more about your state’s history than I do.
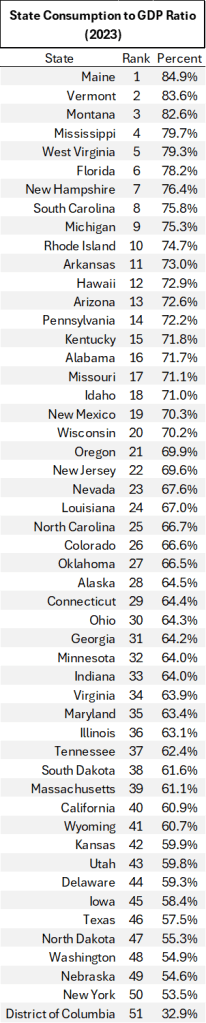
How does your state measure? Below is the full table for 2023.
Sources:
State Consumption: https://fred.stlouisfed.org/graph/?m=1tteG
State GDP: https://fred.stlouisfed.org/graph/?m=1ttfl
State Population: https://fred.stlouisfed.org/graph/?m=1ttfm

Had no idea this differed so much by state
LikeLike