I’ve written before on this blog about “time prices”: the amount of time it takes at a particular wage to buy a specific product. Time prices are especially useful for making historical comparisons of the real price of a good or service. Rather than adjusting historical prices for inflation (which only tells you whether they have increased faster or slower than average prices), time prices give you a real comparison of whether a good has become more or less affordable.
Antony Davies recently did a 100-year comparison of time prices for an average worker in the US. He compared prices in 1924 for several common food items, gasoline, electricity, movie tickets, airline tickets, an automobile, and several measures of housing costs to the best comparable thing in 2024. This following table shows his results:

You will notice a few things here. For the median worker, most things are much more affordable in 2024. Some things are dramatically so! For many items, the median worker in 2024 is similar to someone in the top 1% in 2024. Huge improvements in the standard living.
It will probably not surprise you that one major exception is housing. For renters, things are not obviously worse, but they are not better, depending on what size of city you are in (renters also have lower incomes, but that would be true in both time periods). However compared to the average home price, things look much worse in 2024. You can reasonably reply that the home is much larger and better quality in 2024 (as late as 1940, barely half of homes had complete indoor plumbing!), and this is all true. Still, an average house today is much better, but also much less affordable.
Despite the high cost of housing, the average worker today is much better off than 1924. It’s hard to deny it.
But what about more recent times? As a recurring meme likes to date it, what about since 1971?
First, let me point you to a recent analysis of finished goods by Marian Tupy. He looked at 75 goods found in the 1971 Sears catalog, and compared them to similar goods today. On average using “time prices” these goods are much cheaper, about 80 percent more affordable than 1971. That’s pretty good! In total, it looks like just 8 of those 75 items are less affordable (they include things like cowhide leather belts, lined moccasins, and a football helmet). Tupy and his frequent co-author Gale Pooley frequently use time prices, such as in their book Superabundance.
But I wanted to do a similar comparison as Davies, using 1971 as the starting point, to go beyond just finished goods you would find in the Sears catalog back then (or Walmart today). So I did some digging, and I was mostly able to replicate the Davies table comparing 1971 and 2024:
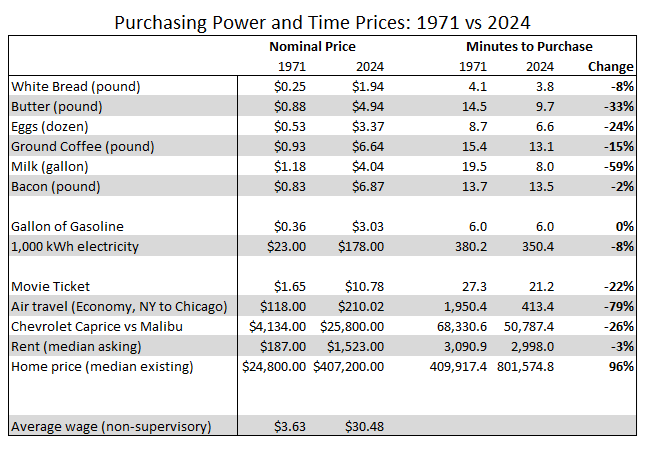
There is a striking similarity to the 1924 comparison: almost everything except housing is now more affordable. But buying a house is a lot less affordable!
Food is definitely more affordable, with only bacon being on the borderline (when I did a grocery price comparison to 1980, bacon also came out the only item that was less affordable — sorry bacon lovers!). Gasoline is roughly equally affordable, though that’s only after the steep declines in recent months (note: for food and energy prices in 2024 I’m using the October BLS average price data, which is the most recent). Movie tickets, air travel, and cars are all cheaper (though if you picked the cheapest Chevy in 1971, the Vega, it would be more affordable than a Malibu today — the last car Chevy produces for the US market).
But oh boy, housing is much more expensive. And since 1971 you can’t really argue the quality improvements make up for the increase. Yes, houses are much bigger (about double in size), but that’s not clearly driven by consumer demand (more so by zoning and other laws). The 1971 house also had indoor plumbing (but maybe not air conditioning).
UPDATE: see my new post on housing prices and quality from 1971 to 2023.
For the curious, here are links to the sources I used for 1971 prices:
- Food prices (Table 572)
- Gasoline
- Electricity
- Movie ticket (I double checked this at several other places)
- Air travel
- Chevy Caprice
- Rent and housing (I’m less certain these are perfectly comparable, please send me better comparisons if you have them)
Finally, I am using the average wage for production and nonsupervisory workers for all the calculations, which increased about 8-fold since 1971. You might think averages are skewing this, but median personal income actually increased more (over 9-fold from 1971 to 2023), so that’s not an issue here.

Unfortunately it’s not groceries that are killing our budget, it’s insurance and utilities and internet.
LikeLike