A few weeks ago I wrote a post comparing housing costs in 1971 to today. I noted that while houses had gotten bigger, the major quality improvement for the median new home was the presence of air conditioning: a semi-luxury in 1971 (about 1/3 of new homes), to a standard feature in 2023. Even accounting for the presence of central air-conditioning and more square footage, I concluded that housing was about 17 percent more expensive in 2023 than 1971 (relative to wages).
However, if we consider the housing quality of the poorest Americans, the improvements go beyond air-conditioning and more square feet. A recent paper in the Journal of Public Economics titled “A Rising Tide Lifts All Homes? Housing Consumption Trends for Low-Income Households Since the 1980s” has important details on these improvements (ungated WP version). In addition to larger homes, there was “a marked improvement in housing quality, such as fewer sagging roofs, broken appliances, rodents, and peeling paint. The housing quality for low-income households improved across all 35 indicators we can measure.”
Overall, the number of poor American households living in “poor quality” housing was roughly cut in half from 1985 to 2021, from 39% to 16% among social safety net recipients, or from 30% to 12% for the bottom quintile. The 12-16% of poor households that still have poor quality housing is much more than we would like, but these are dramatic improvements over a period when many claim there was stagnation in the standard of living for poor Americans.
This figure from the paper shows the improvements for the different features:
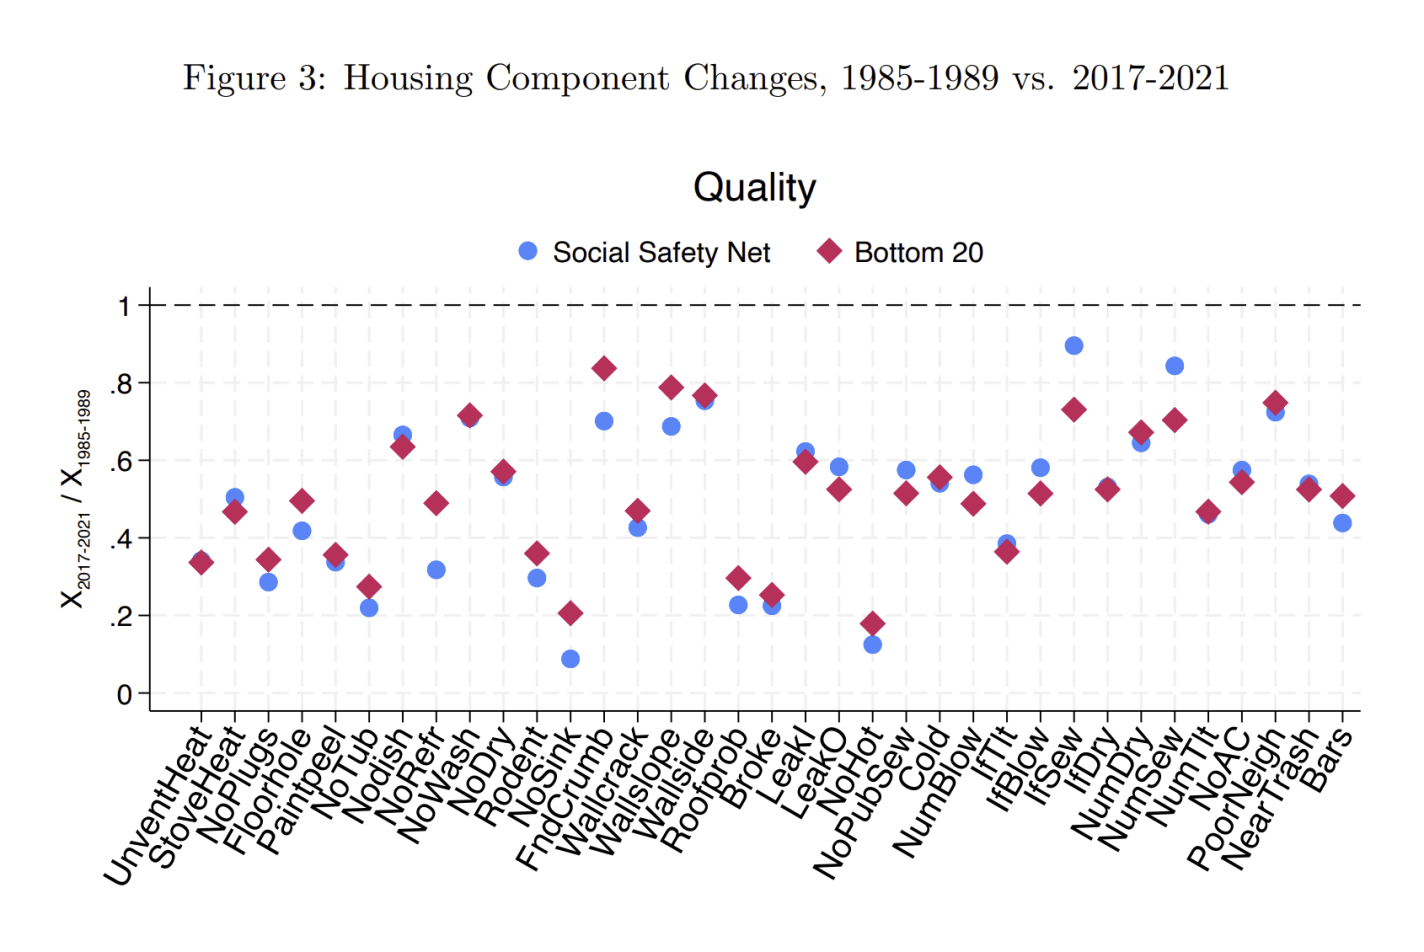
For example, the number of households with no hot water was just 20% of what it was in the late 1980s. Some of the other major improvements are also related to plumbing and water, such as the number having no kitchen sink or no private bathtub/shower, but there was also a big decline in the presence of rodents in the house. All of the 35 indicators they looked at showed improvements, on average a 50% reduction in the number of households with these poor-quality components. This paper only uses data back to 1985, but almost certainly there would be even larger improvements if we used 1971 as the starting point.
While the median new home in 1971 had complete indoor plumbing, this was clearly not true for many poor households even through the 1980s. When we talk about the increasing cost of housing for the poorest Americans, much of that improvement does represent essential quality improvements — and not merely more square feet and air conditioning (though they did get these improvements too).
