UPDATE: This thread on Twitter from the Atlanta Fed provides some clarification on how this model is behaving (it is probably overstating the decline due to gold inflow).
You may have seen the following chart recently:
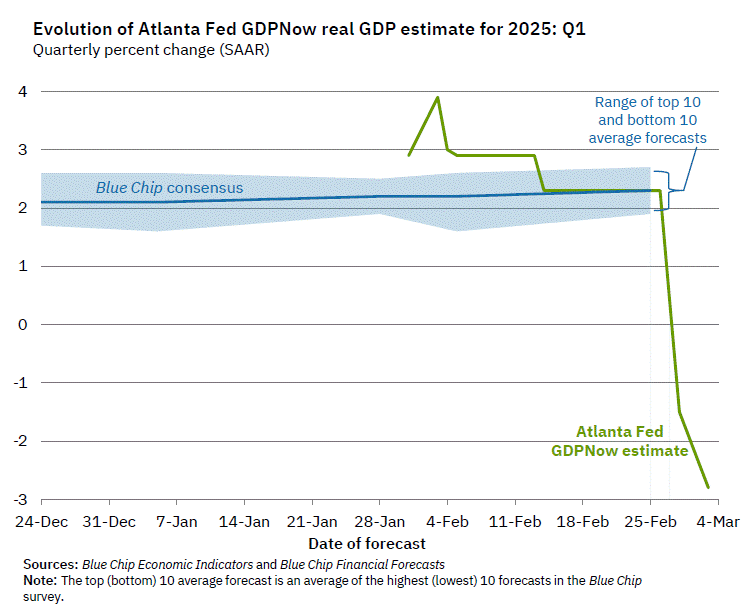
The chart comes from the Atlanta Fed’s GDPNow model, which tries to estimate GDP growth each quarter as data becomes available. The sharp drops in their Q1 forecast for 2025, based on the last two data updates, look pretty shocking. Should we be worried?
First, it’s useful to ask: has this model been accurate recently? Yes, it has. For Q4 of 2025, the model forecast 2.27% growth — it was 2.25%. For Q3 of 2024, the model forecast 2.79% growth — it was 2.82%. Those are very accurate estimates. Of course, it’s not always right. It overestimated growth by 1 percentage point in Q1 of 2024, and it underestimated growth by 1 percentage point the quarter before that. So pretty good, but not perfect. Notable: during the massive decline in Q2 2020 at the start of the pandemic, it got pretty close even given the strange, uncertain data and times, predicting -32.08% when it was -32.90% (that’s off by almost 1 percentage point again, but given the highly unusual times, I would say “pretty good”).
OK, so what can we say about the current forecast of -2.8% for Q1 of 2025? First, almost all of the data in the model right now are for January 2025 only. We still have 2 full months in the quarter to go (in terms of data collection). Second, the biggest contributor to the negative reading is a massive increase in imports in January 2025.
To understand that part of the equation, you have to think about what GDP is measuring. It is trying to measure the total amount of production (or income) in the United States. One method of calculation is to add up total consumption in the US, including by final consumers, business investments, and government purchases and investments. But this method of calculation undercounts some US production (because exports don’t show up — they are consumed elsewhere) and overcounts some US production (because imports are consumed here, but not produced here). So to make GDP an accurate measure of domestic production, you need to add in exports, and subtract imports.
Keep in mind what we’re doing in this calculation: we aren’t saying “exports good, imports bad.” We are trying to accurately measure production, but in a roundabout way: by adding up consumption. So we need to take out the goods imported — not because they are bad, but because they aren’t produced in the US.
The Atlanta Fed GDPNow model is doing exactly that, subtracting imports. However, it’s likely they are doing it incorrectly. Those imports have to show up elsewhere in the GDP equation. They will either be current consumption, or added to business inventories (to be consumed in the future). My guess, without knowing the details of their model, is that it’s not picking up the change in either inventories or consumption that must result from the increased imports. It’s also just one month of data on imports.
As always, we’ll have to wait for more data and then, of course, the actual data from BEA (which won’t come until April 30th). More worrying in the current data, to me, is not the massive surge in imports — instead, it’s that real personal consumption expenditures and real private fixed investment are currently projected to be flat in Q1. If consumption growth is 0% in Q1, it will be a bad GDP report, regardless of everything else in the data.

One thought on “Understanding the Projected GDP Decline”