I’ve discussed complete proteins before. I’ve talked about the ubiquity of protein, animal protein prices, vegetable protein prices, and a little but about protein hedonics. My coblogger Jeremy also recently posted about egg prices over the past century. Charting the cost of eggs is great for identifying egg affordability. But a major attraction of eggs is that they are a ‘complete protein’. So how much of that can we afford?
Here I’ll outline a model of the optimal protein consumption bundle. What does this mean? This means consuming the quantities of protein sources that satisfy the recommended daily intake (RDI) of the essential amino acids and doing so at the lowest possible expenditure. Clearly, this post includes a mix of both nutrition and economics. Since a comprehensive evaluation that includes all possible foods would be a heavy lift, here I’ll just outline the method with a small application.
Consider a list of prices for 100 grams of Beef, Eggs, and Pork.* We can also consider a list that identifies the quantity that we purchase in terms of hundreds of grams. Therefore, the product of the two yields the total that we spend on our proteins.


Of course, not all proteins are identical. We need some characteristics by which to compare beef, eggs, and pork. Here, I’ll use the grams of essential amino acids in 100 grams of each protein source. Because there are different RDIs for each amino acid, I express each amino acid content as a proportion of the RDI (represented by the standard molecular letter).

Then, we can describe how much of the RDI of each amino acid that a person consumes by multiplying the amino acid contents by the quantities of proteins consumed.
Our goal is to find the minimum expenditure, B, by varying the quantities consumed, Q, such that the minimum of C is equal to one. If the minimum element of C is greater than one, then a person could consume less and spend less while still satisfying their essential amino acid RDI. If the minimum element is less than one, then they aren’t getting the minimum RDI.
How do we find such a thing? Well, not algebraically, that’s for sure. I’ll use some linear programming (which is kind of like magic, there’s no process to show here).
The solution results in consuming only 116.28 grams of Pork and spending $1.093 per day. The optimal amino acid consumption is also below. Clearly, prices change. So, if eggs or beef became cheaper relative to pork, then we’d get different answers.

In fact, we have the price of these protein sources going back almost every month to 1998. While pork is exceptionally nutritious, it hasn’t always been most cost effective. Below are the prices for 1998-2025. See how the optimal consumption bundle has changed over time – after the jump.

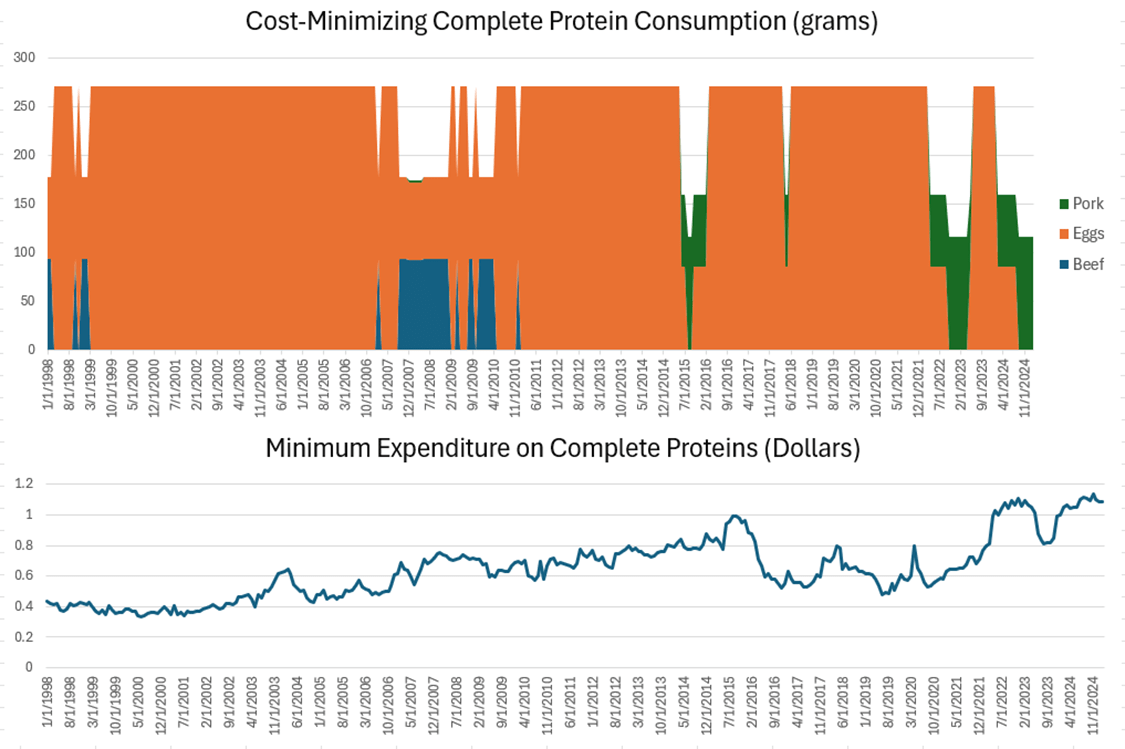
Repeating the cost-minimization problem subject to consuming at least the RDI of complete proteins and at given prices, we get the below graphs. The first is a stacked area graph of the grams of consumption that solves the optimization problem for each period. The 2nd is the minimized cost. Historically, eggs ruled the day. They were so cheap, that you could get complete proteins by eating 270g per day and no other sources of protein. During the financial crisis it made sense to complement that consumption with beef and only recently did substantial portions of pork make budgetary sense. Note that the total mass consumed dips anytime that meat is added to the consumption bundle due to its nutritional density.
Jeremy examined whether we can afford more or less eggs than we could historically. But that emphasizes the income effect only. In reality, people substitute away from goods that are becoming more expensive and toward goods that are becoming less expensive. If eggs become expensive, then people substitute to other things. So, the question should not be whether we can afford more eggs. The question is whether we can afford more of what eggs provide us: complete proteins. Indexing to January 1998 as the base year, the below chart shows that the price of complete proteins relative to average production and non-supervisory wages, while volatile, is no more expensive now that in 1998.**

All of this is for demonstration only. Clearly, I’ve omitted many other sources of protein like chicken and legumes. Including those makes the picture look even rosier. In addition, a limitation of this analysis is that I’ve ignored the non-amino acid characteristics of these foods. They also contain fatty acids, vitamins, and minerals that I have ignored – much less whether you happen to prefer one food over the other. I’ve entirely neglected preferences. All the same, protein is no less affordable than it was 25 years ago.
*I use the same prices from The Price of a Complete [Animal] Protein
**If I had included alternatives, like chicken, then the affordability improves dramatically.

One thought on “Optimal Protein Consumption in the 21st Century: A Model”