In macroeconomics we have basic tools to help us talk about economic growth, which is simply the percent change in RGDP per capita. What causes growth? Lot’s of things. All else constant, if more people are employed, then more will be produced. But the productivity of those workers matters too. That’s why we calculate average labor productivity (ALP), which is the GDP per worker. This tells us how much each worker produces. All else constant, more ALP means more GDP.*
What affects ALP? Nearly everything: Technology, demographics, health, culture, and public policy. Most of these have long-term effects. So, it’s better to think in terms of regimes. After all, incurring debt now can result in a lot of investment and production, but there’s no guarantee that it can be sustained year after year. This is why I don’t get terribly excited about individual good or bad policies at any moment. There’s a lot of ruin in a nation. I care more about the long-run policy regime that is fostered over time.
Given the variety of inputs to economic growth, there’s always plenty of room for complaint about policy – even if the economy is doing well. In this post, I’m inspired by a Youtube video that a student shared with me. The OP laments poor policy in Massachusetts. But compared to some other nearby states, MA is doing just fine economically. This is not the same as saying that the OP is wrong about poor policies. Rather, a regime of policy, technology, interests, etc. is built over time and there can be a lot wrong in growing economies.
In the interest of being comprehensive, this post includes basic growth stats for all states from 2005 through 2024 (the years of FRED-state GDP).** First, let’s start with the basic building blocks of population, employment, and RGDP. Institutions matter. Policy affects whether people migrate to/from the state, fertility, how many people are employed, and what they can produce.
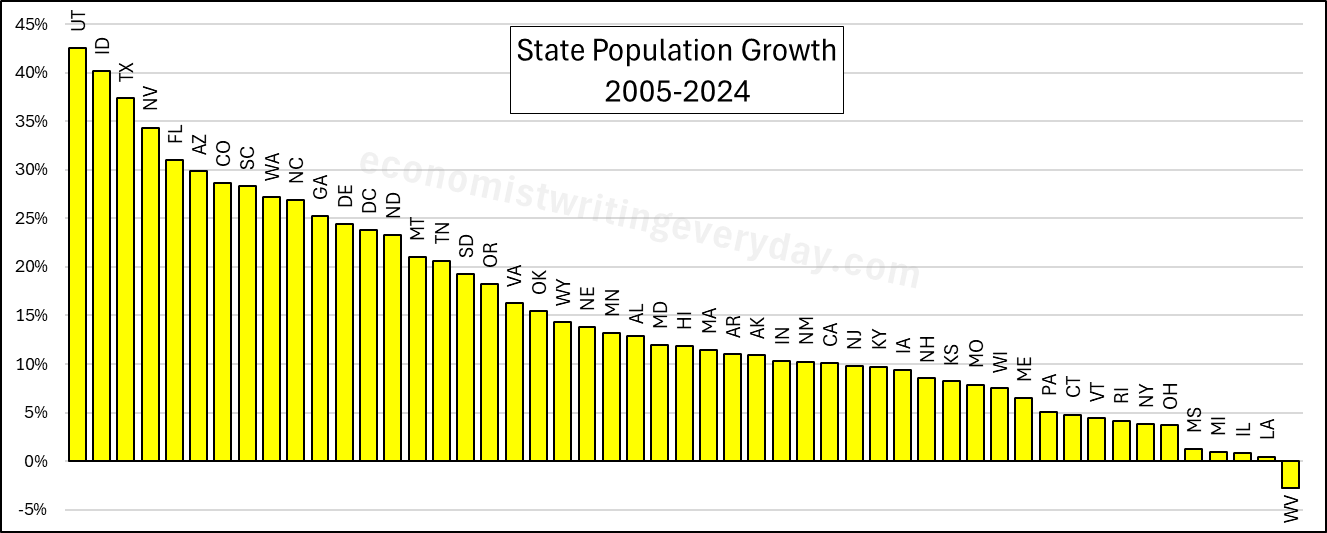
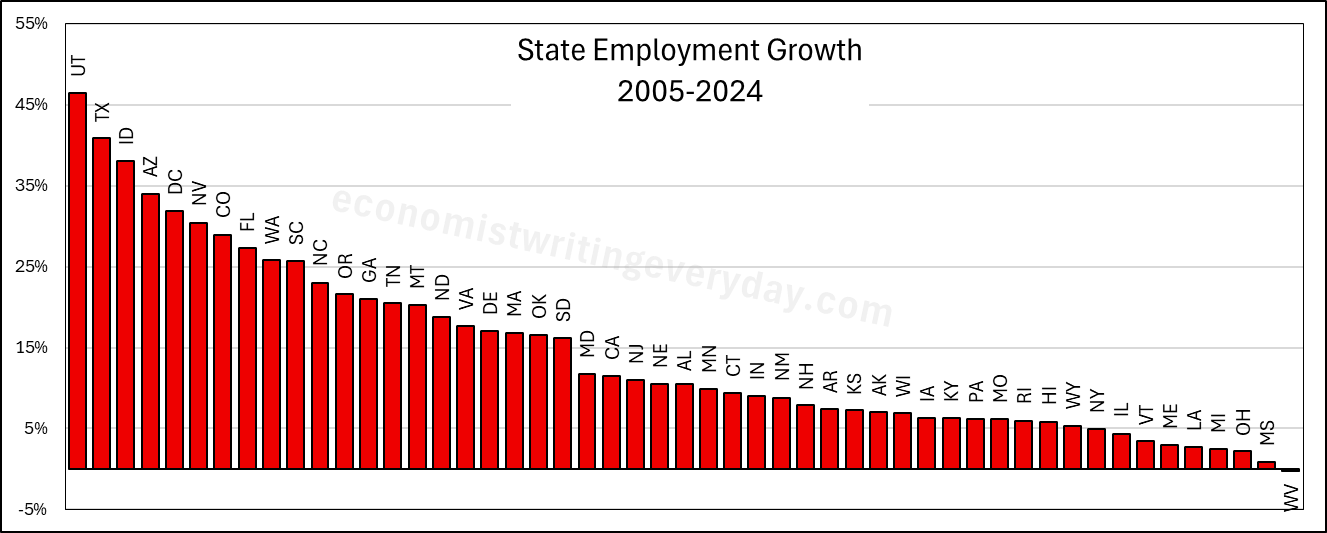
People like to talk about migration and the flocking to Texas & Florida. But that fails to catch the people who choose to stay in their state. Utah is 43% more populous than it was 20 years ago. But you don’t hear much clamoring for their state policies. Idaho and Nevada also beat Florida in terms of percent change. Where are the calls to be like Idaho? Employment largely tracks population, though not perfectly. The RGDP numbers can change quickly with commodity prices, reflected in the performance of North Dakota. But remember, these numbers cover a 20 year span. So, any one blockbuster or dower year won’t move the rankings much.

Of course, these figures just set the stage. What about the employment-population ratio, ALP, and RGDP per capita? Read on.
Below is the change in employment share – the proportion of people who are employed and contributing to output. This is the only graph that is expressed in percentage points. Texas and Utah still look pretty good. But Florida? A lower proportion are working now than in 2005. That’s probably driven by the rising retiree population. But look at the top two. DC is generally a ‘working’ city. Young or prime age professionals are there to work. But Massachusetts also looks pretty good. Maybe they sent their senior citizens to Florida. Or, maybe they adopted some better labor policies or attracted workers from other states. Notice that these aren’t huge changes over a 20 year span. The impact of individual policies is generally small.

Economists care a lot about ALP. More productive workers implies time well spent rather than wasted. North Dakota ranks up there for fracking and energy price reasons. But Washington and California are in 2nd and 3rd place in terms of ALP growth. California doesn’t look so bad in this light. The popular narrative is that people leave California and that it’s hard to work/build/operate there. The data is not inconsistent. It may be that California’s stats benefit from the ALP of ‘high enough’ productivity workers, while the lower productivity workers left the state, closed shop, or work informally. Given that we’re using just the basic building blocks, it’s fun to see that we can provide *some* evidence for or against popular beliefs. Of course, you’d want to do a deeper dive.

Finally, the big kahuna is RGDP per capita. The fact that Washington and California are still in the top three tells us that the common story about flocking from California isn’t quite right. People’s income grew faster there on average, which means that inequality/dependency isn’t a macro problem there. People in California are productive per worker *and* per capita. Texas still looks good, but Florida is in the bottom of the pack with a measly 18% growth rate over the twenty year period. New York also comes out looking pretty healthy.

In summary, there is a lot of ruin in a state. But individual policies come from a broader governance regime. There is always something to dislike and complain about. But that’s why we have a federalism. If you don’t like the particular policies in one state, then you can go elsewhere. There are trade-offs between taxes and club-goods in magnitude and character. But the growth statistics give us a quick and rough gut-check. Is Massachusetts doing terribly? Not at all! Its economic growth is in the top quintile of states – as are a lot of other states that you may not expect. *** How does your state compare?
*Since there is diminishing marginal product of labor, a higher employment-population ratio implies a lower ALP, given some production function.
**There are other sources that go back further. But FRED is what I’m using.
***All being in the US makes the stats quite comparable. However, differences in industry-related tax burden or demographic-related social program utilization can definitely affect these numbers. How important that is depends on your argument.
