I’m piggy-backing off of the FRED blog and off of Jeremy’s post with yet more data. Let’s set the stage.
- FRED blog, using BLS data from the Current Population Survey (CPS), shows that the labor force participation rate (LFPR) fell by about 1.4pp for people 55 years and older between 2017 & 2023. CPS data is released quickly, but the sample sizes are not massive. There are 3.4 million people in the 7 years of monthly data (so, a little over 40k people age 55+ per monthly observation).
- Also using CPS data, Jeremy shows that FRED commits the fallacy of composition because there are very different people who are 55 and older. Specifically, he illustrates that the LFPR for people ages 55-64 have experienced about a 1.3pp *higher* LFPR in 2023 vs 2017. The implication is that something is happening to the people older than 64.
- I use annual CPS instead. Why? Because it can be corroborated with the annual American Community Survey (ACS) data for 2017-2023.
Being annual data, we don’t get the same kind of granularity across time. The data also ends in 2023. But, we gain better granularity across age and a larger sample size with the ACS than with the CPS that underlies the FRED & BLS numbers. The ACS data includes almost 8 million people for 2017-2023 (so 1.14 million people age 55+ per annual observation). What does the larger sample size say? Let’s start by establishing the baseline facts.
The figures below show the annual LFPR for all people 55+ (black line), people 55-64 (blue), and people age 65+ (red). The left figure uses CPS data & the right figure uses ACS data.* Note that the 65+ group uses a different vertical axis on the right, but both axes have the same height so that changes can be easily compared between series. The CPS data generally reflect a worse picture than the ACS data. Between 2017 & 2023. For individuals ages 55-64 the CPS data say that the LFPR rose by 1pp and the ACS data says the rise was a whopping 2.4pp! The CPS numbers are also less exciting than ACS for the 55+ age group from 2017 to 2023 (-1.5pp vs -0.1pp). The CPS said the LFPR for the 65+ group fell by less than 0.2pp and the ACS says that it *rose* by 1.3pp.

Overall, the data agree that the 55-64 LFPR rose, and that the 55+ rate changed more negatively than the 65+ rate. Both data sets reflect that the combined LFPR for all people age 55+ paints a dimmer picture than the both of the subgroups individually. What gives?
I was tempted to delve into all sorts of things: income, disability, assisted living, employment changes, and even grandchildren childcare. But none of these things are driving the overall rate if neither subpopulation LFPR is falling a great deal. There’s no big decline among subgroups that needs explaining.
The answer has everything to do with the age composition. See below. The share of people age 65+ has been rising for years. That is, the average person older than 55 is older than they used to be. There was a dip after 2020 that might be related to covid deaths among the most senior among us, but that was brief and the ultimate trend was little changed. The rising share means that the overall LFPR for the 55+ group includes relatively fewer 55-64 people who have a higher LFPR, and relatively more 65+ people who have a lower LFPR.
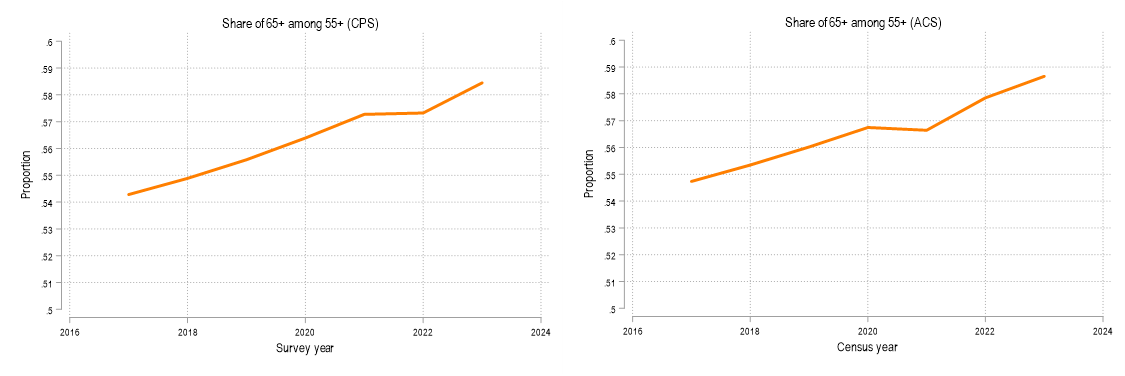
The changing age composition of the 55+ population may be what’s driving the artifact that the CPS data reports. Namely, as the proportion of people age 65+ rises, the more the 55+ LFPR starts to look like the older people and less like the people in the 55-64 age group.
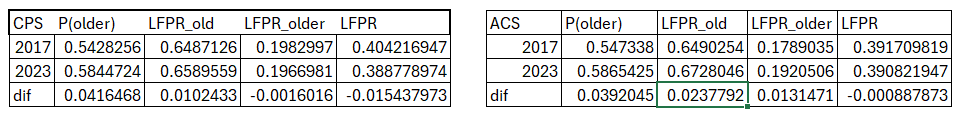
The biggest factor determining the multi-year fall in the 55+ LFPR is that a greater proportion of people are in the 65+ group. People of age 55-64 are working more than they were previously and people of age 65+ are also working more than they did previously (ACS data). Suffice it to say that the change for them isn’t massively negative in the CPS data either.
The part that remains a mystery to me is the timing of the kinks in the above proportion graphs. Why would the CPS data show a plateau in 2022 and the ACS data show a plateau in 2021? Maybe the survey person-weights are updated or estimated differently in a relevant way? That’s my suspicion on my part, having not done a deeper dive.
Here is the math work if you’re interested:
*For the CPS data I weighted the individuals by their annual weight rather than their monthly weight which introduces a very small error in my numbers.
