Leveraged Bullion and Mining Funds to Cash in on the Gold Bonanza

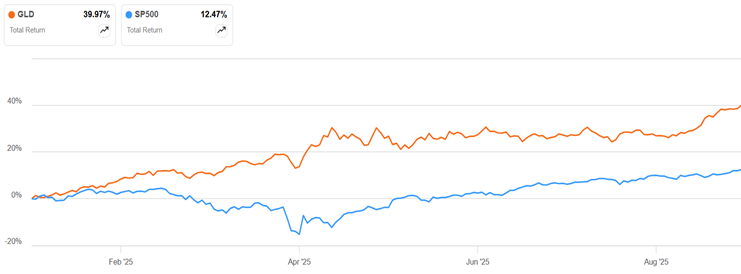
Stocks (e.g., S&P 500) are up 12.5 % year to date. That is pretty good for 9.5 months. But gold has been way better, up 40%:

Fans of gold cite various reasons for why its price should and must keep going up (out of control federal debt and associated money-printing, de-dollarization by non-Western nations, buying by central banks, etc.). I have no idea if that is true. But if it is, that raises the question in my mind:  for the limited amount of funds I have to invest in gold, can I get more bang for my investing bucks, assuming gold continues to rise?

It turns out the answer is yes.  A straightforward way is to buy into a fund which is 2X or 3X leveraged to the price of gold. If gold goes up 10%, then such a fund will go up 20% or 30%. Let’s see how two such funds have done this year, UGL (a large 2X gold fund) and a newer, smaller 3X fund, SHNY:

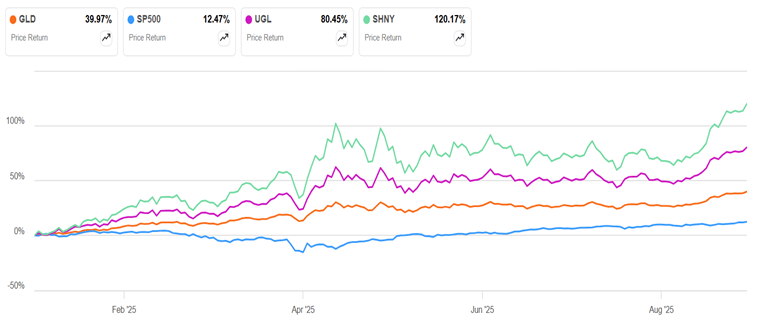
Holy derivatives, Batman, that leverage really works! With GLD (1X gold) up 40%, UGL was up 80% year to date, and 3X SHNY is up 120%. So, your $10,000 would have turned into $24,000. The mighty S&P500 (blue line) looks rather pitiful in comparison.

But wait, there’s more. Let’s consider gold “streamers”, like WPM (Wheaton Precious Metals) or FNV. They give money to mines in return for a share of the production at fixed, discounted prices, so their cash flow soars when gold prices rise. Year to date, FNV is up 73%, while WPM is up 91%.

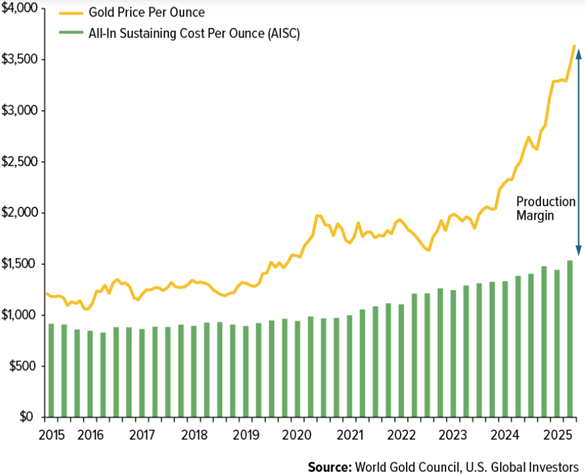
And then there are the gold miners themselves. They tend to have fairly fixed breakeven costs of production, currently around $1200-1400/oz.  Again, their profit margin rockets upward when gold prices get far above their breakeven:

Source

GDX is a large fund of representative mining stocks. For icing on the cake, there are funds that are 2X (NUGT) or 3X (GDXU) leveraged to the price changes in mining stocks. The final chart here displays their year-to-date performance in all their glory:

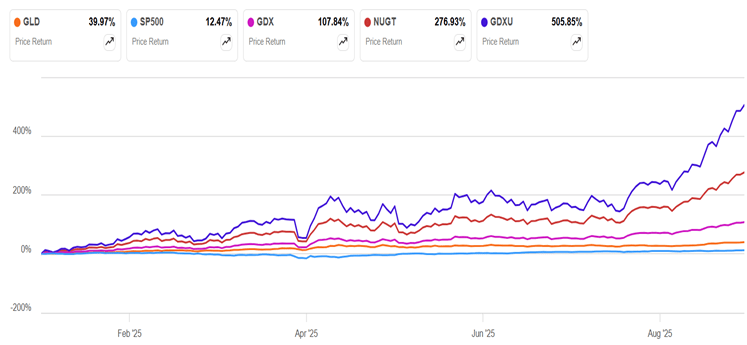
The blue S&P 500 line is lost in the noise, and even the orange 40% GLD line is left in the dust. The 1X miner fund was up 108%, the 2X fund NUGT was up 276%, and the 3X GDXU was up 506%. Your $10,000 would have turned into $51,000.

Of course, what goes up fast will also come down fast, since leverage works both ways. For instance, from Oct 21 to Dec 30, 2024, gold was down a mere 4%, but WPM was down 15%, the 1X gold miner GDX was down 20%, and 3X GDXU down an eye-watering 54%. That means that your $10,000 turned into $4,600 in two months. Imagine watching that unfold, and not panic-selling at the bottom. Gold fell by more than half between 2011 and 2015. If it fell by even 20% (i.e., gave up half of this year’s gains), I could see a 3X miner fund losing over 90% of its value (just a guess).

One more twist to mention here is the “stacked” fund GDMN, which uses derivatives to be long 1X gold PLUS 1X gold miners. It is up 151% this year, which is nearly four times as much as gold. This fund seems to have a nice combination of decent leverage with moderate volatility. It has on average kept pace with the 2X miner fund NUGT, with shallower dips. NUGT has surged way ahead in the past two months as miner stock prices have gone nuts, but that is somewhat exceptional.

Disclaimer: As usual, nothing here should be considered advice to buy or sell any security.

Is This a Stock Market Correction or a Bear Market?

As of the market open today, tech stocks (e.g. the NASDAQ 100 fund QQQ) are down more than 10% from their recent highs. The broader S&P 500 fund SPY is down about 8%. Hands are wringing…what does it all mean?

By applying standard definitions, we can know exactly what it means:

A pullback is a market drop of 5-10% and is very short term.  It is a dip from a recent high during an ongoing bull market while upward momentum is still intact, and is a normal adjustment to a market cycle.

The market is in correction phase” after a drop between 10-20% and can last a few months. These moves are typically met with higher volatility.  Corrections can be violent as investors’ fear levels rise and panic selling may hit the market.

Real time news and social media can intensify this fear as investors may follow the herd mentality.   The average market correction lasts anywhere between two and four months and is frequently accompanied by adverse market conditions.  However, corrections are often seen as ideal times to buy high-value stocks at discounted prices.

So, technically, the S&P has experienced a “pullback”, while the NASDAQ 100 has undergone a “correction”. Just to round out the infernal trinity of market moves with a definition of a “bear market”:

A bear market occurs after a drop of 20+% over at least a two-month time frame.  In a bear market, investor confidence has been shattered and many investors will sell their stocks for fear of further losses.  Trading activity tends to decrease as do dividend yields.

Bear markets tend to become vicious cycles when rallies are sold and not bought This happened in 2000 and 2007 and can typically be seen on charts as the market makes lower lows and lower highs.  Bear markets tend to occur in the contraction phase of the business cycle and last, on average, approximately 16 months.

You don’t know if you are really in a bear market until things get really bad, at which point it is probably too late to sell. (Amateurs get discouraged and sell AFTER stocks have dropped, which is why the average investor does appreciably worse than the accounts of dead people where stocks just sit there without being traded). When stocks recover at least 20% following a bear market over at least a two-month period, that is defined as the start of a new bull market regime.

Having a correction (i.e. 10-20% dip) in the middle of a bull market year is pretty normal. Although whole-year market returns have been positive for 34 out of the past 45 years, the typical year experiences a correction averaging 14%.

None of this vocabulary clarification answers the practical question of how bad will the current pullback/correction get? As usual, I read argument on both sides. The bears are saying (a) what they have been saying since 2018 or so, that the market is unrealistically overvalued, and (b) the macroeconomic world is about to fall apart, which they have also been saying for years. This time may be different, with the new administration’s erratic policies, but history shows that so far, the market is not much correlated to who is in the West Wing.

The bulls are saying (a) the market values did get run up unrealistically after the election and with AI hype, so the current pullback is just a healthy reset to a level for resuming further market growth, and (b) despite negative talking, the actual numbers show decent employment and GDP, so macro is OK (and it is very rare to have an actual bear market absent a serious bad macroeconomic driver).

If I really knew the answer here, I would be writing this from my private Caribbean island. But I’ll share how I am playing it. For the past 15 years or so, it has nearly always worked well to buy in after a say 10% correction. What seemed so gut-wrenching and scary at the time almost always turns into just a blip on the endlessly rising market charts in hindsight.

I had set aside some “dry powder” funds specifically to take advantage of buying opportunities like now. So, I am manfully mastering my fears and buying small amounts every couple days of 2X levered funds like SSO and QLD. (See here for discussion of such funds, they go up or down $2 for every $1 the underlying S&P or NASDAQ go up or down, so it’s kind of like being able to buy twice as much stock for the same dollar amount. But as usual, caveat emptor).

But I am not going all-in on any particular day. It is always frustrating to miss buying right at the bottom, but nobody rings a bell there, either. I have searing memories of March 2020 and of 2008 when just when you thought the bottom was in, it dropped out the next day or week.

Disclaimer: Nothing here should be considered advice to buy or sell any security.

How to (Almost) Double Your Investing Returns 3. “Stacked” Multi-Asset Funds

Two weeks ago we described a simple way to achieve roughly double investing returns on some asset class like an S&P 500 stock basket, or on some commodity like gold or oil, by buying shares in an exchange-traded fund (ETF) whose price moves up or down each day two times as much as the price of the underlying stocks or commodities. For instance, if the S&P 500 stocks go up (or down) by 2% on a given day, the price of the SSO ETF will move up (or down) by 4%.  And last week we noted that buying deep in the money call options can also result in an investment which can move up or down by twice the percentage of the underlying stock. These call options side-step the volatility drag implicit in the 2X funds, but require some housekeeping on the investors part to roll them over once or twice a year.

Today we present a third approach for multiplying the return on your investment dollars. This is to buy shares of a fund which holds two different asset classes, in a leveraged form. As an example: if you buy $100 worth of the fund PSLDX, you are buying the equivalent of $100 worth of S&P 500 stocks PLUS about $100 worth of long-dated US Treasury bonds. (PSLDX happens to be an old-fashioned mutual fund, not an ETF, but no matter). It works like this: The fund takes your $100 and buys a bucket of bonds. It then uses those bonds as collateral, and uses futures to get around $100 worth of exposure to the price movements of the S&P 500 stocks. There is not quite a free lunch here, since there is a “carry” cost on the futures, which is about equal to the LIBOR/SOFR short term interest rates (currently ~ 5%).

PSLDX does not promise exactly 100/100  stock/bond exposure, but it comes out pretty close much of the time. A similar product is NTSX which is leveraged x1.5. It gives 90/60 stocks/mixed-term bonds. NTSX has outperformed PLSDX in recent years, since the price of long-term (10-20 year) bonds has been crushed due to the rise in interest rates. RSSB is a recent entry into this space, offering 100/100 exposure to global stocks/laddered Treasuries.

Another reason these leveraged stock/bond products have done relatively poorly in the past two years is that the cost of leverage is actually higher than the bond coupons, due to the inverted yield curve.  This problem will go away if the Fed lowers short-term rates back down to near zero, as they were prior to 2022, but lingering inflation makes that prospect unlikely.

That said, if I have $200 to invest and want $100 stock and $100 bond coverage, I can put $100 into one of these 100/100 funds, and still have $100 left to collect interest on or to invest in some other, hopefully higher-yielding venue. So, these stock/bond funds have their place.

Where this so-called asset stacking shines even more is combining stocks or bonds with something like managed futures. Managed futures are an excellent diversifier for equities (see here). Moreover, since managed futures are typically held in both long and short positions, there will be less financing (carry) cost associated with them. When both stocks and bonds cratered in 2022, managed futures went up. Thus, funds like BLNDX (50 global stocks/100 managed futures) and MAFIX (stocks plus managed futures) went up in 2022, and then continued to rise as stocks recovered. Thus, the returns for these two funds have been steadier and higher than plain stocks (SP 500) over the past three years:

Total returns for past three years, for BLNDX (50 stocks/100 managed futures), SP500 stocks, BND broad US bonds, and MAFIX stacked multi-asset.

BLNDX and its sister fund REMIX are readily available at most brokerages (I hold some), while MAFIX may have daunting minimum investment requirements. RSST is a recent 100/100 stock/managed futures ETF that is easily invested in, and seems to be performing well.

Disclaimer: As usual, nothing here should be considered advice to buy or sell any investment.

How to (Almost) Double Your Investing Returns 2. Buy Deep in the Money Calls

Last week we described a simple way to achieve roughly double investing returns on some asset class like an S&P 500 stock basket, or a narrow class of stocks such as semiconductors, or on some commodity like gold or oil. That way is to buy one of the many exchange-traded funds (ETFs) which use sophisticated derivatives to achieve a 2X or even 3X daily movement in their share prices, relative to the underlying asset. For instance, if the S&P 500 stocks move up by 2% on a given day, the SSO ETF will rise by 4%.

Of course, these leveraged funds will also go down two or three times as much. They also have a more subtle disadvantage, which is that when the markets go up and down a lot, they tend to lose value due to their daily reset mechanism.

In this post we describe a different way to achieve roughly double returns, which does not suffer from this volatility drag issue. This way is to buy long-dated deep in-the-money call options on a stock or a fund.

Say what? We have described how stock options work here and here. The reader who is unfamiliar with options should consult those prior articles.

A stock option is a contract to buy (if it is a call option) or to sell (if it is a put option) a given stock at some particular price (“strike price”), by some particular expiration date. Investors generally buy calls when they believe that the price of some stock or fund will go up.  For a call option with a strike price far below the current market price of a stock, the market price of the option will move up and down essentially 1:1 with the market price of the stock.

For instance, as I write this the market price of Apple is about $230. Suppose I think Apple is going to go up by say $40 in the next six months. One way for me to capture this gain is to invest $230 in buying Apple stock. The alternative propose here is to instead of buying the stock itself, buy, say, a call option with a strike price of $115 and an expiration date of January 17, 2025. The current market price of this option is about $119.

Other things being equal, we expect that the market value of this call option will go up by $40 if Apple itself goes up by $40. But we have invested only $119, rather than $230, so our return on our investment is roughly double with the option than by buying the stock itself.

There is a subtle cost to this approach. At a stock price of $230 and a strike price of $115, the intrinsic value of this call option is $115. But we pay an extra $3 of extrinsic value when we buy the option for $118. This extrinsic value will gradually decay to zero over the next six months.

Thus, if Apple went up by $40 within the next month or so, we could turn around and sell this call option for nearly $40 more than our purchase price. But if we wait for six months before selling it, we would only net $37 (i.e., $40 minus $3). This is still fine, but it illustrates that there is a steady cost of holding such options. This annualized cost is about equal to or slightly higher than the prevailing short term interest rate (5% /year). This option pricing makes sense, since an alternative way to control this many shares would be to borrow money at current interest rates (5%) and use those borrowed funds to buy Apple shares. Options and futures pricing is generally rational, to make things like this equivalent, or else there would be easy arbitrage profits available.

As a side comment, the reason I am focusing on deep in the money calls here is that the extrinsic premium you pay in buying the call gets lower the further away the strike price is (i.e. deeper in the money) from the current stock price. A deeper in the money call does cost you more up front, but net net its dollar movements up and down more closely track (1:1) the movements of the underlying stock. So, if I am not trying to guess right on any market timing, but simply want to get the equivalent of holding the underlying stock but tying up less money to do so, I find buying a call that is about 50% in the money generally works well.

How I Use Deep in the Money Call Options

I consider the technology-oriented stock fund QQQ to be a core holding in my portfolio, so I would like to stay exposed to its movements. But I might as well do this on a 2X basis, to make better use of my funds. I do hold some of the 2X ETF QLD. But if we experience a lot of market volatility, the price of QLD will suffer, as explained in our previous post.

As a more conservative approach here, I recently bought a deep in the money call on the QQQ ETF. As usual, I went for a call option with a strike price roughly half of the market price, with an expiration date 6-12 months away. When this gets close to expiration (May-June next year), I will “roll” it forward, by selling my existing call option, and buying a new one dated yet another 6-12 months further out. This takes little work and little decision making. I will pay the equivalent of about 5% annualized cost on the decay of the extrinsic option premium, but I come ahead as long as QQQ goes up more than 5% per year.

This is a little more work than just holding the 2X QLD ETF, but it gives me a bit more peace of mind, knowing I have done what I can to smooth out some of the risk there. Of course, if QQQ plunges along with the markets in general, I will be looking at double the losses. For that reason, I am taking some of the money I am saving by using these leveraged approaches, and stashing it in safe money market funds. In theory that should give me “dry powder” for buying more stocks after they drop. In practice, I may be too frozen with fear to make such clever purchases. But at any rate, I should not be appreciably worse off for having used these leveraged investments (2X funds or deep in the money calls).

Disclaimer: As usual, nothing here should be considered advice to buy or sell any investment.

How to Roughly Double Your Investing Returns 1. 2X (or 3X) Leveraged Funds

Most years, stocks go up, by something like 9%. Wouldn’t it be nice to invest in a fund that went up double those amounts? Such funds exist. They use futures or other derivatives to move up (or down!) by double, or even triple, the percentage that the underlying stock or index moves, on a daily basis.

For instance, a common unleveraged fund (ETF) is SPY that roughly tracks the S&P 500 index of large U.S. stocks is SPY. SSO is a 2X fund, which gives double the returns of SPY, on a daily basis. UPRO is a 3X fund, giving triple the returns. 2X funds exist for many different asset classes, including semiconductor stocks, treasury bill, and crude oil – see here. And similarly for 3X funds.

Since all the action in stocks these days seems to be in large tech companies, I will focus on the NASDAQ 100 index universe. The leading unleveraged fund there is QQQ. The 2X version is QLD, and the 3X is TQQQ. Let’s look at how these three funds performed over the past twelve months:

QQQ is up a respectable 36%, but QLD is up by 70%, and TQQQ by a mouth-watering 106%. You could have doubled your money in the past twelve months simply by investing in a 3X fund instead of holding boring 1X QQQ. 

These leveraged funds can be utilized in more than one way. One approach is to just put the monies you have allocated for stocks into such funds, and hope for higher returns. Another approach is to put, say half of your speculative funds into a 2X fund (to get roughly the same stock exposure as putting all of it into a 1X fund), and then use the remaining half to put into other investments, or to keep as dry powder to give you the option to buy more equities if the market crashes.

What’s not to like about these funds? It turns out that a year of daily doubling of returns does not necessarily add up to doubling of yearly returns. There is “volatility drag” associated with all the exaggerated moves up and down. As an illustration of how this works, suppose you held a stock that went down by 50% one day, say from a price of $100 to $50. The next day, it went back up by 50%. But this would only get you back to $75, not $100.

It turns out that with these leveraged funds, as long as stocks are generally going up, the yearly returns can match or even exceed the 2X or 3X targets. But in a period with a lot of volatility, the yearly returns can fall far short. And in a down year, the combination of the leverage and the volatility drag lead to truly horrific losses. For instance, here is what 2022 looked like for these funds:

QQQ was down by 31%, which is bad enough. But imagine your $10,000 in TQQQ melting down to $3,300 that year.

And here is the chart from January 2022 to the present:

QQQ is up 27% in the past 2.5 years, 2X QLD is up only 16%, while 3X TQQQ is actually down by 6%, as it could not recovery from 2022.

This was a kind of a worst-case scenario, since 2022 was an exceptionally bad year for QQQ, coming off a fabulous 2021. A chart of the past five years, which includes the 2020 Covid crash and recovery, and the 2022 crash and subsequent recovery still shows the leveraged funds coming out ahead over the long term:

The net returns on QLD (321%) were about double QQQ (158%), while the more volatile TQQQ return (386%) was plenty high, but fell well short of three times QQQ.

In my personal investing, I hold some QLD as a means to free up funds for other investments I like. But if I smell major market trouble coming, I plan to swap back into plain QQQ until the storm clouds pass.

There are some other ways to get roughly double returns, which suffer less from volatility drag than these 2X funds. I will address those in subsequent posts.

Disclaimer: As usual, nothing here should be considered advice to buy or sell any investment.