Can Actively Managed Stock Funds Beat the Market?

For many people nowadays, investing in “stocks” means buying a fund like SPY or VOO which tracks the large cap S&P 500 index, or maybe QQQ or QQQM which track the tech-heavy NASDAQ 100 index. These types of funds are exchange-traded funds (ETFs), which very low annual fees (around 0.2% or so).  These are so-called passive funds, which mechanically buy and sell stocks such that their holdings match what is in their respective indices. No extra judgment on stock picking is required.

An alternative is to pick stocks yourself, or to buy into a fund with active management, where humans (and their algorithms) try to buy stocks which will beat the passive indices, and try to avoid losing stocks. The active versus passive debate has been going on for decades.  There will always be some active funds that outperform in any given year. These successes help keep the allure of active management alive. On average, though, the performance of active funds (before fees) is generally not much different than the passive funds. Thus, with their added fees, the active funds are net losers.

However, there are always cheerful fund managers with a story on how they have a plan to kill it this year, and there are investors willing to buy those stories. Sometimes these fund managers take financial advisors out for expensive lunches, and, behold, said advisors then recommend these actively managed funds to their clients. And so, there are plenty of active funds that still exist. New ones are minted every year, even as some older ones go out of business.

A problem with benchmarking against a cap-weighted fund like SPY or QQQ is that these passive indices are actually very effective. These work as closet momentum-rewarding funds: as the share price of, say, Microsoft goes up and up (presumably because of accelerating earnings), its representation among the biggest 500 companies (by stock capitalization) goes up. Thus, the better, growing companies automatically keep making bigger contributions to the indices, while fading companies sink to lower and lower per cent weighting. That works well to relentlessly home in on the relatively few stocks that account for the gains of the entire market, and to weed down all those other firms, most of which are net losers on stock price over time.  This algorithm governing the cap weighted funds is tough for active management to beat.

Having stated these challenges, I’d like to compare performance of some actively-managed funds that have shown enhanced performance in recent years. The problem is, of course, we cannot know if this outperformance will continue. But hopefully looking at performance and discussing the underlying strategies of the funds may help investors decide if they would like to participate in any of them.

Two broad categories of stock funds are growth and value. Growth looks at how fast a firm is increasing revenues, earnings, etc. Most tech stocks command high share prices because of their growth prospects, rather than current earnings (although many of the current big tech leaders generate gobs of cash). Value looks at measures such as price/earnings and price/sales and price/book value, hoping to find undervalued firms whose price does not yet reflect the underlying value. Tech funds are generally under-represented in the value category.

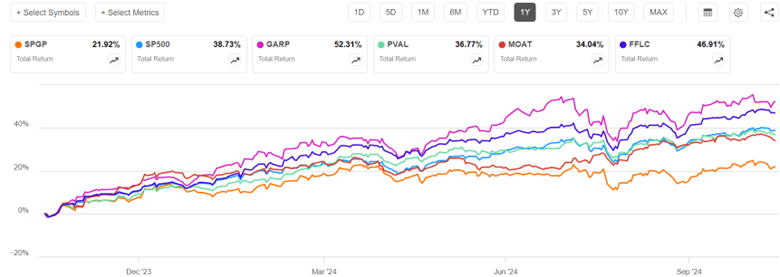
Here we will look at five good actively-managed ETFs, and compare total returns (with dividends reinvested) to the S&P 500 fund SPY. They all claim to incorporate both growth and value into their stock picking. These five funds are:

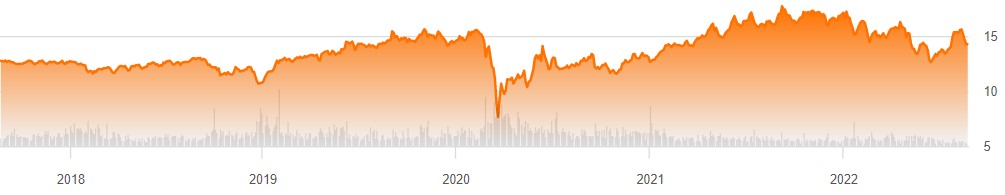
SPGP – This is a supposed “growth at a reasonable price” fund, which seems to weight value more than growth. In top ten holdings, there is only one tech stock, a 2.7% weighting of Nvidia. There are four petroleum companies, and diverse smattering of other types of firms.

GARP – Another “growth at a reasonable price” (note “G.A.R.P.”) fund. This tilts heavily toward growth: seven of the top ten holdings are tech, with 5.43% Nvidia.

PVAL –  As indicated in the name (Putnam Focused Large Cap Value), this is a value fund, but with some growth considerations – –  The top ten are:  Walmart (retail), Exxon Mobil (petro), Thermo Fisher Scientific, Citigroup, Bank of America (finance), Oracle (tech), UnitedHealth Group (healthcare), Coca-Cola, NXP Semiconductors, and PulteGroup (homebuilder).

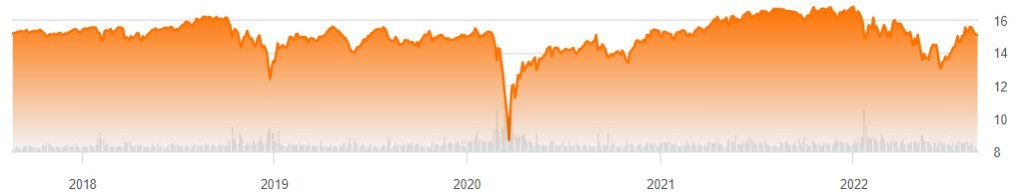
MOAT – – “VanEck Morningstar Wide Moat”  – This fund seeks to replicate the performance of the Morningstar® Wide Moat Focus Index, which in turn tries to identify a diverse group of U.S. large companies with wide “moats”, that give them sustainable advantages over competitors. Four measures are used to determine a corporation’s dominance: Intangible Assets (brands, patents, proprietary technologies); Switching Costs (inconvenient for the customer to find an alternative); Network Effect (when customers use one service, they adopt additional company services); Cost Advantage.

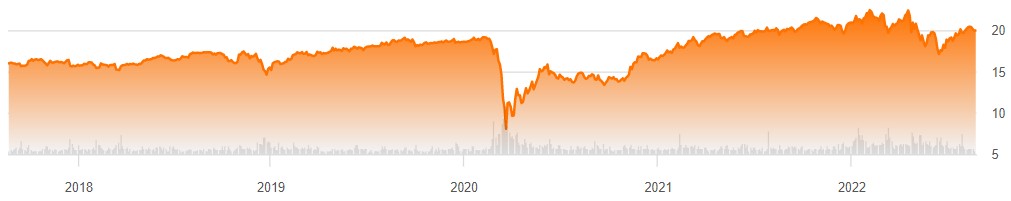
FFLC – This fund uses “fundamental analysis” and looks for companies that can take advantage of trends in “technological advances, product innovation, economic plans, demographics, social attitudes, and other factors”. An analysis of the fund’s holdings (heavy in big tech; 6% Nvidia) shows a strong focus on growth and momentum, with a moderate value weighting.

All these funds have plausible rationales for choosing the stocks they do. A big question is always: how much of a company’s promise is already reflected in its stock price? If everyone else has already figured out that, say, Microsoft will have high sustained earnings growth, then maybe the current share price is so high that it will not go up any faster than the broad market.

Now for the charts. I will discuss 1-year, 3-year, and 5-year charts, so we can see how the fund strategies worked in different market regimes. The one-year chart covers the raging bull market of the past twelve months, especially in AI-related tech/growth stocks. The 3-year chart encompasses a lengthy bear episode that occupied most of 2022, in reaction to the raising of interest rates to tamp down inflation. The 5-year chart includes the brief but sharp pandemic panic March-April 2020, sandwiched in a huge rise in internet-related big tech stocks 2019-2021.

One-Year Chart

Over the past one year, GARP (52% return) soared way above S&P 500 (blue line, 39%), but with high volatility, consistent with its heavy growth/tech exposure. FFLC steadily pulled ahead of SP500 over the past twelve months, racking up a 47% return. PVAL and MOAT finished close to SP500, while tech-poor SPGP flat-lined in the most recent six months and so got left far behind.

Three-Year Chart (End Oct 2021-end Oct 2024)

The defining features of the past three years were a roughly 21% bear market decline in S&P 500 during Jan-Oct 2022, followed by a strong recovery, which was interrupted by a moderate slump July-Oct 2023.    FFLC and PVAL performed nearly identically for the first third of this time period (through early March, 2023). They dropped much less than SP500 in 2022, and so by early March, 2023 they were some 15% ahead of SP500. PVAL’s lead over SP500 shrank a bit over the next twelve months, and then widened March-July 2024, to give PVAL (43%) a 16% advantage over SP500 (27%) at the end of three years.  FFLC just kept steadily widening its lead over SP500, ending with a 58% return over this three-year time period. MOAT and SPGP also fell less than SP500 in 2022, but fell more than PVAL and FFLC, and they did not keep pace with the tech-led surge in 2023-2024. In the end, MOAT finished essentially even with SPY, and SPGP finished lower (18%). Tech-heavy GARP crashed harder than SP500 in 2022, but more than made up for it with the 2024 tech-fest, finishing well above SP500 and tied with PVAL at 43%.

I won’t show the full five-year chart, since some of the funds did not start prior to that period. But I will make a few semi-quantitative comments. The five-year time period is a little kinder to SPGP – this fund showed a fairly consistent lead over SP500 in 2021 as well as 2022, and so got rave reviews then in the investing literature. It was only in the past six months that it performed so poorly.

FFLC got off to a rocky start, falling about 10% behind SP500 in 2020-2021, although its winning ways since then gave it the overall best 5-year performance. GARP and MOAT pretty much kept pace with SP500 Oct 2019-Oct 2021, so their five-year performance vs SP500 is about the same as for three-year (GARP soundly beat SP500, MOAT roughly tied).

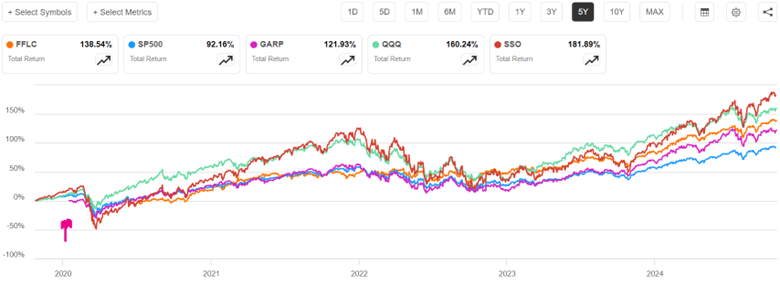
One more chart (below), a five-year comparison of SP500 to FFLC (overall winner among the active funds discussed above) and GARP (tech-heavy) to QQQ (passive, tech-heavy, tracks NASDAQ 100 stocks) and SSO (its stock price moves up and down 2X the daily price movement of S&P500). GARP didn’t start operation till early 2020 (marked by red arrow on chart), to its curve should be shifted up to make a fair comparison with the others; with this correction, it would end up roughly tied with FFLC, with both these funds beating SP500 by about 33% (135% return vs 92%). But even these stellar active funds were soundly beaten by QQQ and even more by the passive 2X fund SSO. Holders of SSO, however, would have suffered heart-stopping drawdowns along the way (e.g. over 50% loss in market value in early 2020).

Readers can draw their own conclusions from this flyover of results. Just like you can fool people some of the time, any active fund may beat “the market” (e.g., S&P 500) some of the time. Some active funds seem to beat the market most of the time. But it is most unlikely that any given fund will beat it all of the time. The S&P 500 algorithm is actually pretty effective. It may behoove the investor to make their own judgement as to what market regime we are in or are about to be in, and to choose active funds which are more likely to thrive in that regime.

I am motivated to include some FFLC (for overall consistent good performance) and PVAL (for a bit of crash protection) in my holdings. But I recognize that their performance could deteriorate in the future, if their investing style no longer works in some new market regime. SPGP is a cautionary example, going from rock star in 2021-2022 to awful in 2024. Even FFLC had an unfavorable first year of operation. The tech giants that dominate QQQ continue to also dominate earnings growth, so QQQ may continue to outpace SP500.

As far as SSO, I earlier wrote on strategies for 2X returns using 2X funds or call options. If you think stocks are going to keep going up, it can make sense to hold these 2X funds. Many advisors, though, recommend against just buy and hold because of the enormous possible losses in a crash; too many investors panic and sell at a low price in that situation. I hold some QLD, which is a 2X QQQ fund, but only as a minor component of my portfolio. Also, if I can overcome fear in the moment, I plan to swap out of plain vanilla stock funds and into a 2X fund like SSO after the next big dip in the market, and then swap back out of SSO after the market recovers.

Disclaimer: Nothing here should be considered advice to buy or sell any security.

Funds Paying “Return of Capital” Give You (Sort of) Tax-Free Income

The stock of an individual company like AT&T, or a stock fund, often pays a dividend or distribution. Typically, these dividends are taxed as income. If you buy shares of a fund like MUNI that hold municipal bonds from U.S. states and cities, the dividends from that are not taxed by the feds (they are taxed on state income taxes). That’s nice, but the yield from a muni fund MUNI is only 3.3%, and the share price of MUNI drifts around with bond prices; it does not grow like the S&P500 stocks do.

What if there was a way to get highish dividends that are not taxed, at least not in the short term? There is. Funds classify their distributions or dividends in various categories. Net investment income or short-term capital gains are taxed like interest or ordinary income (highest rates). Qualified dividends or long-term capital gain returns are taxed at a lower rate. But “Return of Capital” (ROC) distributions are not taxed at all, when you receive them. (The accounting fiction is that ROC is simply your own investment money being handed back to you, rather than you getting interest or profit, which is why it is not taxed).

ROC only catches up with you when you sell your shares. Every dollar you pocket in ROC goes to lower the formal cost basis of your shares, so that increases the capital gains tax you pay when you sell.  Still, it can mean you defer paying taxes for many years, and when you do sell after many years, you will pay mainly long-term capital gains. Long-term capital gains have relatively low tax rates, and sometimes can be offset with capital losses elsewhere. So, this is a pretty good deal overall. All this only benefits you if you are holding these stocks in a taxable account, not in an IRA.

And, there are ways to not sell your shares, and hence never pay an inflated capital gains tax from all that ROC. One way not to sell your shares is to die (!). Your heirs inherit the funds at the current market value i (stepped-up basis”), without having to pay capital gains. So older folks do deliberately lard up their portfolios with ROC-paying funds or stocks, to leave to their heirs.

Another tactic is to donate the shares to charity. As I understand it, the donation gets valued at current market price, regardless of your cost basis. So, for instance, you might buy shares of XYZ fund at $100/share, collect say $50 in untaxed ROC over the next five years, and then donate the shares for a tax deduction at say $100/share (if their market price had not changed in five years). Obviously, this is only attractive if you wanted to make a charitable donation anyway.

OK, what are some funds or stocks that pay out ROC? There are number of funds which hold stocks, and write (sell) call options on them to generate income. (See here on selling options). Some (not all) of these funds pay out as mainly ROC, and are discussed here. SPYI and ETV are plain vanilla funds holding a basket of S&P500 type stocks, usually with a skew towards tech, and selling call options on them. (Or usually, selling options on an index like SPX or QQQ).  SPYI is currently paying about 11.5% yield, and ETV about 9%, both mainly ROC. ETV happens to be a closed-end fund, which can be good or bad, depending on whether you buy in when the share price is at a discount or premium to the asset value. Right now, ETV is at about a 5% discount, so it is a relatively good time to buy.

It is essential to note with these high yielding funds, the raw yield is practically meaningless. You have to look at total return, which factors in stock price over time as well as cash payout. The reason is that some funds “cheat” by paying huge yields, which sucks in investors, but those yields are not really earned by the fund, so those big payouts gradually deplete the fund’s assets.

FEPI holds an equally-weighted basket of fifteen tech stocks, and sell options on them. By selling options on individual stocks, the options income is huge; FEPI pays about 20% yield. The share price bounces around heavily, being so narrowly concentrated. If tech has a bad/good day, FEPI goes way down/up. QDTE also pays about 20%. It has a more novel strategy, selling “zero-day” options, which I won’t try to explain here. It has only been running about 6 months, but is doing OK.

A problem with all these option-selling funds is that their asset value goes down 10% if the underlying stocks go down 10%, but if stocks recover fast, the value of the funds typically do not recover as much. So, the share price of these funds keeps slipping below the price of a plain stock fund like SPY or QQQ. Now, if stocks go up (which they do most years), the price of an options fund can also go up, just not as much. The lag of these options fund is significant enough that on a total return basis (i.e. with dividends and stock price included), they usually lag behind just holding the stocks. Thus, the only reason to hold these funds is to harvest the tax-free ROC, or if you have a reason to want to generate steady income without selling off stocks.

Some 1-year total returns:

SPY        26.7%   Plain S&P 500  stock fund

SPYI       8.5%      Option fund

ETV        8.8%      Option fund

FEPI       20.2%   Option fund

QDPL     25.9%   Quadruple stock divi fund          

(Note, it is a little random that FEPI looked so good and SPYI and ETV looked poor in the past 12 months; that is not always the case. In the past 6 months, FEPI fared much worse than SPYI and ETV, which only lagged SPY by 1-2%). Some other newish option funds that pay mainly ROC are ISPY (8% yield, sells daily options, very little return lag) and three more with fairly low return drag: XDTE and QDTE (~20% yields, daily options on S&P500 and on NASDAQ 100); QYLG (6% yield; monthly options on half of NASDAQ 100).

Another fund I became aware of recently that pays mainly ROC is QDPL. It does not sell options, so it does not suffer the return lag the other funds do. It uses a futures strategy to take about 15% of the fund assets to garner roughly 4X the normal stock dividends of the S&P500 stocks. It only yields about 5.5%, but its total return keeps up pretty well with SPY. I like this one, and am including it in my portfolio with some of the options funds discussed above.

A whole other class of stocks that pay out mainly ROC is limited partnerships. These are common, e.g., among oil and gas pipeline companies like ET and EPD. These pay 7-8% and also are having strong share price appreciation. But they issue K-1 tax forms, which most mortals don’t want to deal with (I don’t).

As usual, this discussion does not constitute advice to buy or sell any security.

High Yield Investing, 2: Types of Funds; Loan Funds; Preferred Stocks

Types of Funds: Exchange-Traded, Open End, and Closed End

Some investors like to pick individual stocks, while others would rather own funds that own many stocks.  For bonds, investors usually own funds of bonds rather than taking possession of individual bonds.

A straightforward type of fund is the exchange-traded fund (ETF). This holds a basket of securities such as stocks or bonds, and its price is constantly updated to reflect the price of the underlying securities. You can trade an ETF throughout trading hours, just like a stock. If you simply hold it, there will be no taxable capital gains events. Many ETFs passively track some index (e.g. the S&P 500 index of large company stocks) and have low management fees.

An open end mutual fund also trades close to the value of the baskets of securities it holds, but not as tightly as with an ETF. You can place an order to buy or sell an open end fund throughout the day, but it will only actually trade at the end of the day, when the share price of the fund is updated to the most recent value of the net asset value. A quirk of open end funds is that buying and selling by other customers can generate capital gains for the fund, which get distributed to all shareholders. Thus, even if you are simply holding fund shares without selling any, you may still get credited with, and taxed on, capital gains. Also, if a lot of shareholders sell their shares at the bottom of a big dip in prices, the fund must sell the underlying securities at a low price to redeem those shares. This hurts the overall value of the fund, even for customers who held on to their shares through the panic.

Some open end mutual funds offer skilled active management which may meet your needs better than an index fund. For instance, the actively-managed Vanguard VWEHX fund seems to give a better risk/reward balance than the indexed junk bond funds.

Closed-end funds (CEFs) are more complicated. A closed-end fund has typically has a fixed number of shares outstanding. When you sell your shares, the fund does not sell securities to redeem the shares. Rather, you sell to someone else in the market who is willing to buy them from you. Thus, the fund is protected from having to sell stocks or bonds at low prices. The fund’s share price is determined by what other people are currently willing to pay for it, not by the value of its holdings. Shares typically trade at some discount or premium to the net asset value (NAV). The astute investor can take advantage of temporary fluctuations in share prices, in order to buy the underlying assets at a discount and then sell them at a premium. CEFs are typically actively managed, and employ a wider range of investment strategies than open-end funds or ETFs do. CEFs can raise extra money for buying interest-yielding securities by borrowing money. This leverage enhances returns when market conditions are favorable, but can also enhance losses.

Bank Loan Funds

One type of debt security is a loan. Banks can make loans to businesses, with various conditions (“covenants”) associated with the loans. Banks can then sell these loans out into the general investment market.

Most commercial loans are floating-rate, so the interest received by the loan holder will increase if the general short-term commercial interest rate increases. Thus, the loan holder is largely protected against inflation. Loans typically rank higher than bonds in order of payment in case the company goes bankrupt, and some loans are secured by liens on particular company-owned assets like vehicles or oil wells. For these reasons, in the event of bankruptcy, the recovery on loans is higher (around 70%) than for bonds (average around 40%).

Various funds are available which hold baskets of these bank loans, also called senior loans or leveraged loans. One of the largest loan funds is the PowerShares Senior Loan ETF (BKLN), which currently yields about 4.5%. Most of its loans are rated BB and B, i.e. just below investment grade.   There are also closed end funds which hold bank loans, which yield nearly twice as much as the plain vanilla BKLN ETF, by virtue of employing leverage, selling at a discount to the actual asset value of the fund, and expertly selecting higher yielding loans.  For instance,  the Invesco Senior Income Trust (VVR), which I hold,  currently yields 8% , which is enough to keep up with inflation.      

High-Dividend Common Stocks

Most “stocks” you read about are so-called  common stocks. Most company common stocks are valued for their potential to grow in share price or to steadily keep increasing the size of their dividend. The average dividend yield for the S&P 500 stocks is about 1.6%, which is lower than the current yield of the (risk-free) 2-year Treasury bond.

There are some regular (C-corporation) stocks which are not expected to grow much, but which pay relatively high, stable dividends. These include some telecommunication companies like AT&T (T; 6.5%) and Verizon (VZ; 5.9%), electric utilities like Southern (SO; 3.5%) and Duke (DUK; 3.7%), and petroleum companies like ExxonMobil (XOM; 3.6%). Investors might want to buy and hold some of these individual stocks, since these are among the highest yielding, high quality stocks. Broader funds which focus on large high-quality, high-yielding stocks tend to have lower average yields than the stocks mentioned above. For instance the Vanguard High Dividend Yield Index Fund (VHYAX) currently yields only about 3.2 % .  

Preferred Stocks

Companies, including many banks, issue preferred stocks, which behave more like bonds. They  often yield more than either bonds or common stock. Like bonds, most preferreds have a fixed yield; some convert from fixed to floating rate after a certain number of years. Unlike bonds, most preferreds have no fixed redemption date. Fixed-rate preferreds are vulnerable to a large loss in value if interest rates rise, since the shareholder is stuck essentially forever with the original, low rate. On the other hand, if interest rates drop, a company typically can, after a few years, redeem (“call”) the preferred for its face value (typically $25) and then issue a new, lower-yielding preferred stock.

Preferred shares sit above common stock but below bonds in the capital structure. Companies have the option of suspending payment of the dividends on preferred stock if financial trouble strikes. However, a company is typically not permitted to pay dividends on the common stock if it does not pay all the dividends on the preferred stock.

The largest preferred ETF is iShares US Preferred Stock (PFF). It yields about 5.8%, but holds mainly fixed-rate shares. The PowerShares Variable Rate Preferred ETF (VRP; 5.9%  yield) holds variable or floating rate shares, which helps insulate investors from the effects of interest rate raises. The First Trust Intermediate Duration Preferred & Income Fund (FPF) is a closed end fund with more than half its holdings as floating rate. Due to use of leverage and selling at a discount, the fund yield is a juicy 7.9%.

My favorite class of high yield investments is business development companies, discussed here.

Happy investing…

High Yield Investments, 1: Some Benefits of High Yield Stocks and Funds

A Case for High-Yield Investments

The data I have seen indicates that if you don’t need to draw down your investment for twenty years or more, you may do well to put it all in stock funds and just leave it alone. For reasons discussed here  the average investor will likely do better to buy an index fund like the S&P 500 rather than trying to pick individual stocks. The long term average return (including reinvested dividends) in the U.S. stock market has been about 10 %  before adjusting for the effects of inflation. (All my remarks here pertain to U.S. investments; hopefully some aspects may be applicable to other countries).

However, particularly as you age, financial advisors typically counsel investors to allocate some portion of their portfolio to more-stable fixed-income securities that generate cash to spend and keep you from having to sell stocks during a market downturn. Historically, long-term investment grade bonds have been used to provide steady cash, and to serve as an asset which often went up if stock went down. Thus, a 60/40 stock/bond portfolio was considered prudent. That model has been less useful in recent years, since bond yields have been so low, and since long-term bonds sometimes fall along with stocks, e.g. if long-term interest rates rise.

Another driver now for allocating some savings into non-stock investments is that after the large run-up in stocks last few years, which has far exceeded gains in actual earnings, the market may well muddle along flatter in the coming decade. In regular stock investing, you are banking primarily on stock price appreciation – you are counting on someone else paying you (much) more for your shares some years hence than you paid for them. But what if the “greater fools” don’t materialize to buy your shares?

Also, the inflation genie has been let out of the bottle, and it may be tough to get inflation back under say 4%; investment grade bonds are yielding appreciably less than inflation these days, so you are losing money to buy regular bonds.

Finally, if your stock is cranking out say 8% cash dividends, and you are holding it for those dividends rather than for price appreciation, when the market crashes (and this particular stock goes down in price, along with everything), you can be blithe and unruffled. In fact, you can be mildly pleased if the price goes down since, if you are reinvesting the dividends, you can now buy more shares at the lower price. Trust me, this psychological benefit is important.

Some High Yielding Alternative Investments

In this blog over the coming weeks/months we will identify several classes of securities which generate stock-like returns (around 7-10 % returns, if the dividends are continually reinvested) via dividend distributions rather than through share price appreciation. These securities often have short-term volatility similar to stocks, so they should be treated in the portfolio as partly as stock-substitutes rather than as substitutes for stable high-quality bonds. However, the better classes of high yield investments maintain their share prices over a long (e.g. 5-year) period, similar to bonds, but with much higher yields.

We will discuss High-yield (“junk”) bonds , senior bank loans, preferred stocks, Real Estate Investment Trusts (REITs), Business Development Companies, Master Limited Partnerships,   and selling options (put/calls) on stocks.  

I’ll close today with three examples of these high yield securities, which I have happily held for many years. They yield 8-9%, and their share prices have held relatively steady over the past five years:

Cohen&Steers Total Return Realty Fund (RFI). Current yield: 8.0 %

Ares Capital   (ARCC)   Current yield:  8.1%

Eaton Vance Tax-Managed Buy-Write Opportunities Fund (ETV). Current yield: 8.8%                    

(Charts from Seeking Alpha)