Does More Health Spending Buy Better Outcomes for States?

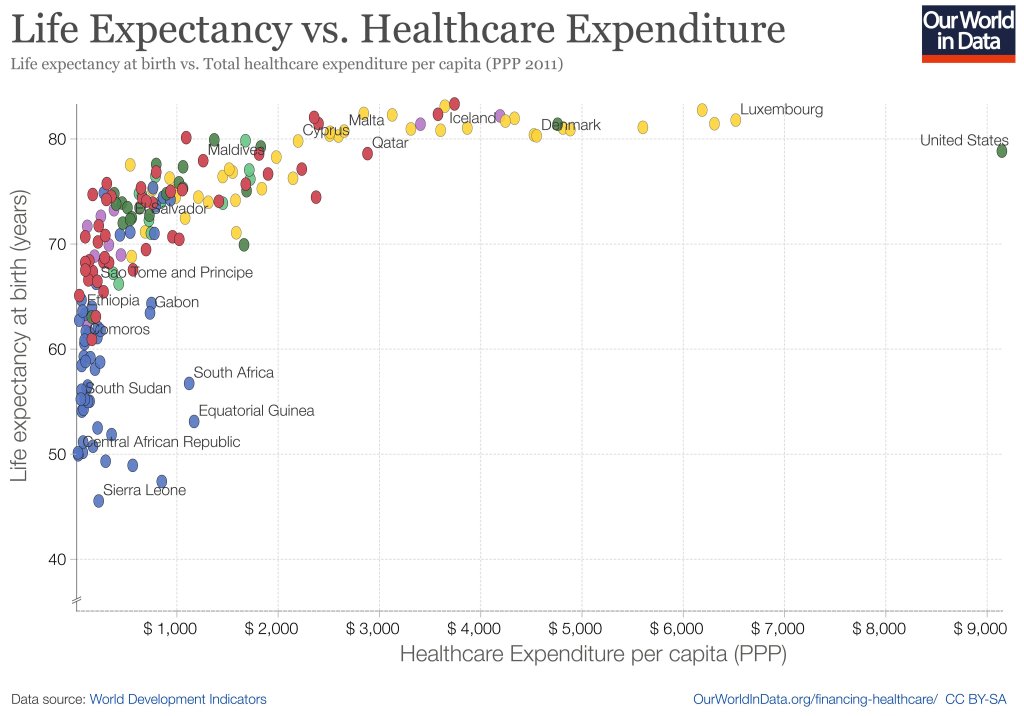
When you look across countries, it appears that the first $1000 per person per year spent on health buys a lot; spending beyond that buys a little, and eventually nothing. The US spends the most in the world on health care, but doesn’t appear to get much for it. A classic story of diminishing returns:

Source: https://twitter.com/MaxCRoser/status/810077744075866112/photo/1

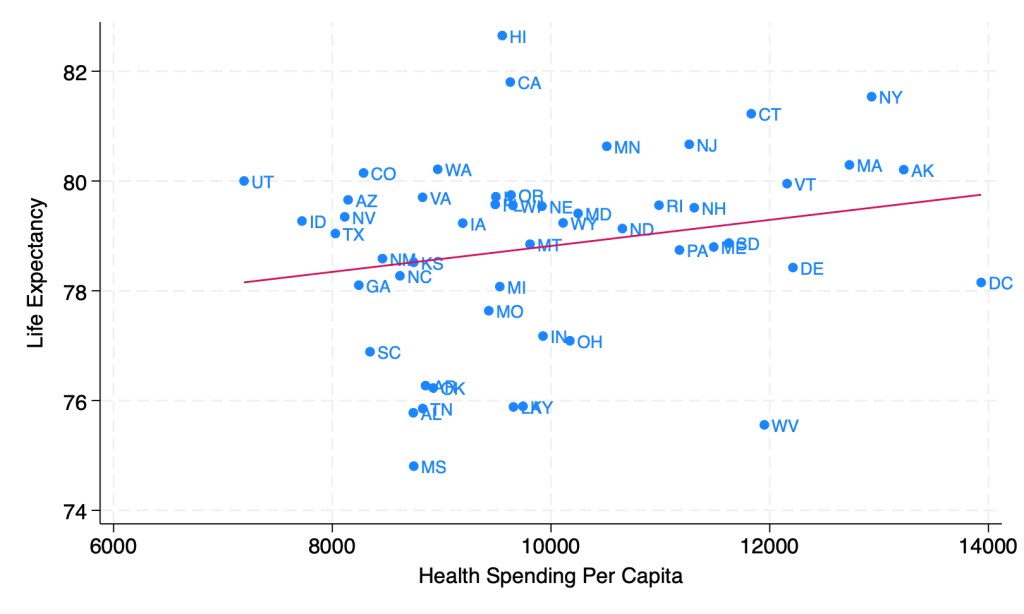
This might tempt you to go full Robin Hanson and say the US should spend dramatically less on health care. But when you look at the same measures across US states, it seems like health care spending helps after all:

Source: My calculations from 2019 IHME Life Expectancy and 2019 KFF Health Spending Per Capita

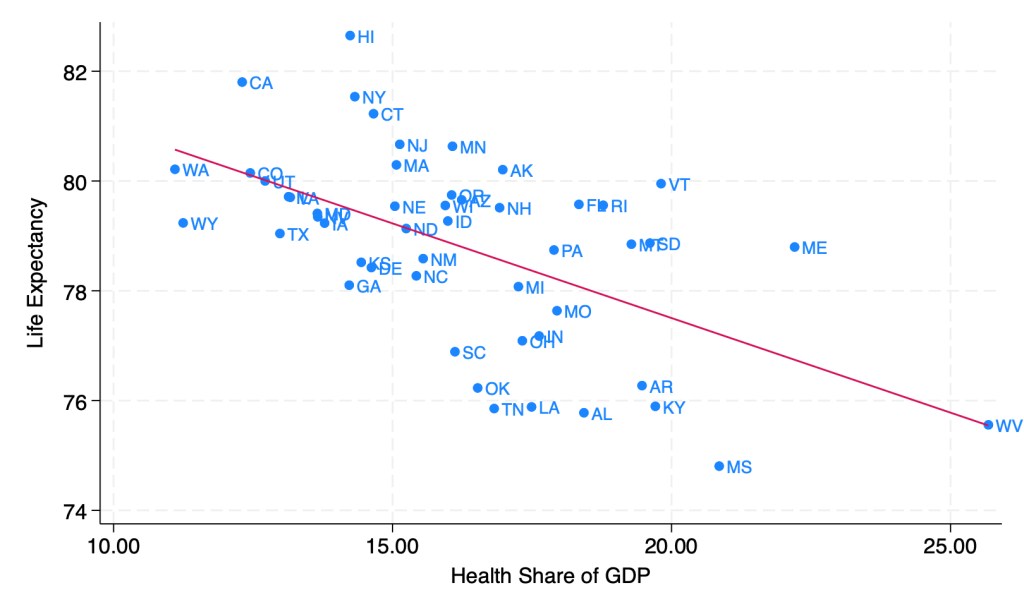
Last week though, I showed how health spending across states looks a lot different if we measure it as a share of GDP instead of in dollars per capita. When measured this way, the correlation of health spending and life expectancy turns sharply negative:

Source: My calculations from 2019 IHME life expectancy, Gross State Product, and NHEA provider spending

Does this mean states should be drastically cutting health care spending? Not necessarily; as we saw before, states spending more dollars per person on health is associated with longer lives. States having a high share of health spending does seem to be bad, but this is more because it means the rest of their economy is too small, rather than health care being too big. Having a larger GDP per capita doesn’t just mean people are materially better off, it also predicts longer life expectancy:

Source: My calculations from 2019 IHME life expectancy and 2019 Gross State Product

As you can see, higher GDP per capita predicts longer lives even more strongly than higher health spending per capita. Here’s what happens when we put them into a horse race in the same regression:

The effect of health spending goes negative and insignificant, while GDP per capita remains positive and strongly significant. The coefficient looks small because it is measured in dollars, but what it means is that a $10,000 increase in GDP per capita in a state is associated with 1.13 years more life expectancy.

My guess is that the correlation of GDP and life expectancy across states is real but mostly not caused by GDP itself; rather, various 3rd factors cause both. I think the lack of effect of health spending across states is real, between diminishing returns to spending and the fact that health is mostly not about health care. Perhaps Robin Hanson is right after all to suggest cutting medicine in half.

Long Covid is Real in the Claims Data… But so is “Early Covid”?

I’ve seen plenty of investigations of “Long Covid” based on surveys (ask people about their symptoms) or labs (x-ray the lungs, test the blood). But I just ran across a paper that uses insurance claims data instead, to test what happens to people’s use of medical care and their health spending in the months following a Covid diagnosis. The authors create some nice graphics showing that Long Covid is real and significant, in the sense that on average people use more health care for at least 6 months post-Covid compared to their pre-Covid baseline:

Source: Figure 5 of “Long-haul COVID: healthcare utilization and medical expenditures 6 months post-diagnosis“, BMC Health Services Research 2022, by Antonios M. Koumpias, David Schwartzman & Owen Fleming

The graph is a bit odd in that its scales health spending relative to the month after people are diagnosed with Covid. Their spending that month is obviously high, so every other month winds up being negative, meaning just that they spent less than the month they had Covid. But the key is, how much less? At baseline 6 months prior it was over $1000/month less. The second month after the Covid diagnosis it was about $800 less- a big drop from the Covid month but still spending $200+/month more than baseline. Each month afterwards the “recovery” continues but even by month 6 its not quite back to baseline. I’m not posting it because it looks the same, but Figure 4 of the paper shows the same pattern for usage of health care services. By these measures, Long Covid is both statistically and economically significant and it can last at least 6 months, though worried people should know that it tends to get better each month.

I was somewhat surprised at the size of this “post Covid” effect, but much more surprised at the size of the “pre Covid” or “early Covid” effect- the run-up in spending in the months before a Covid diagnosis. For the month immediately before, the authors have a good explanation, the same one I had thought of- people are often sick with Covid a couple days before they get tested and diagnosed:

There is a lead-up of healthcare utilization to the diagnosis date as illustrated by the relatively high utilization levels 30–1 days before diagnosis. This may be attributed to healthcare visits only days prior to the lab-confirmed infection to assess symptoms before the manifestation or clinical detection of COVID-19.

But what about the second month prior to diagnosis? People are spending almost $150/month more than at the 6-month-prior baseline and it is clearly statistically significant (confidence intervals of months t-6 and t-2 don’t overlap). The authors appear not to discuss this at all in the paper, but to me ignoring this lead-up is burying the lede. What is going on here that looks like “Early Covid”?

My guess is that people were getting sick with other conditions, and something about those illnesses (weakened immune system, more time in hospitals near Covid patients) made them more likely to catch Covid. But I’d love to hear actual evidence about this or other theories. The authors, or someone else using the same data, could test whether the types of health care people are using more of 2 months pre-diagnosis are different from the ones they use more of 2 months post-diagnosis. Doctors could weigh in on the immunological plausibility of the “weakened immune system” idea. Researchers could test whether they see similar pre-trends / “Early Covid” in other claims/utilization data; probably they have but if these pre-trends hold up they seem worthy of a full paper.