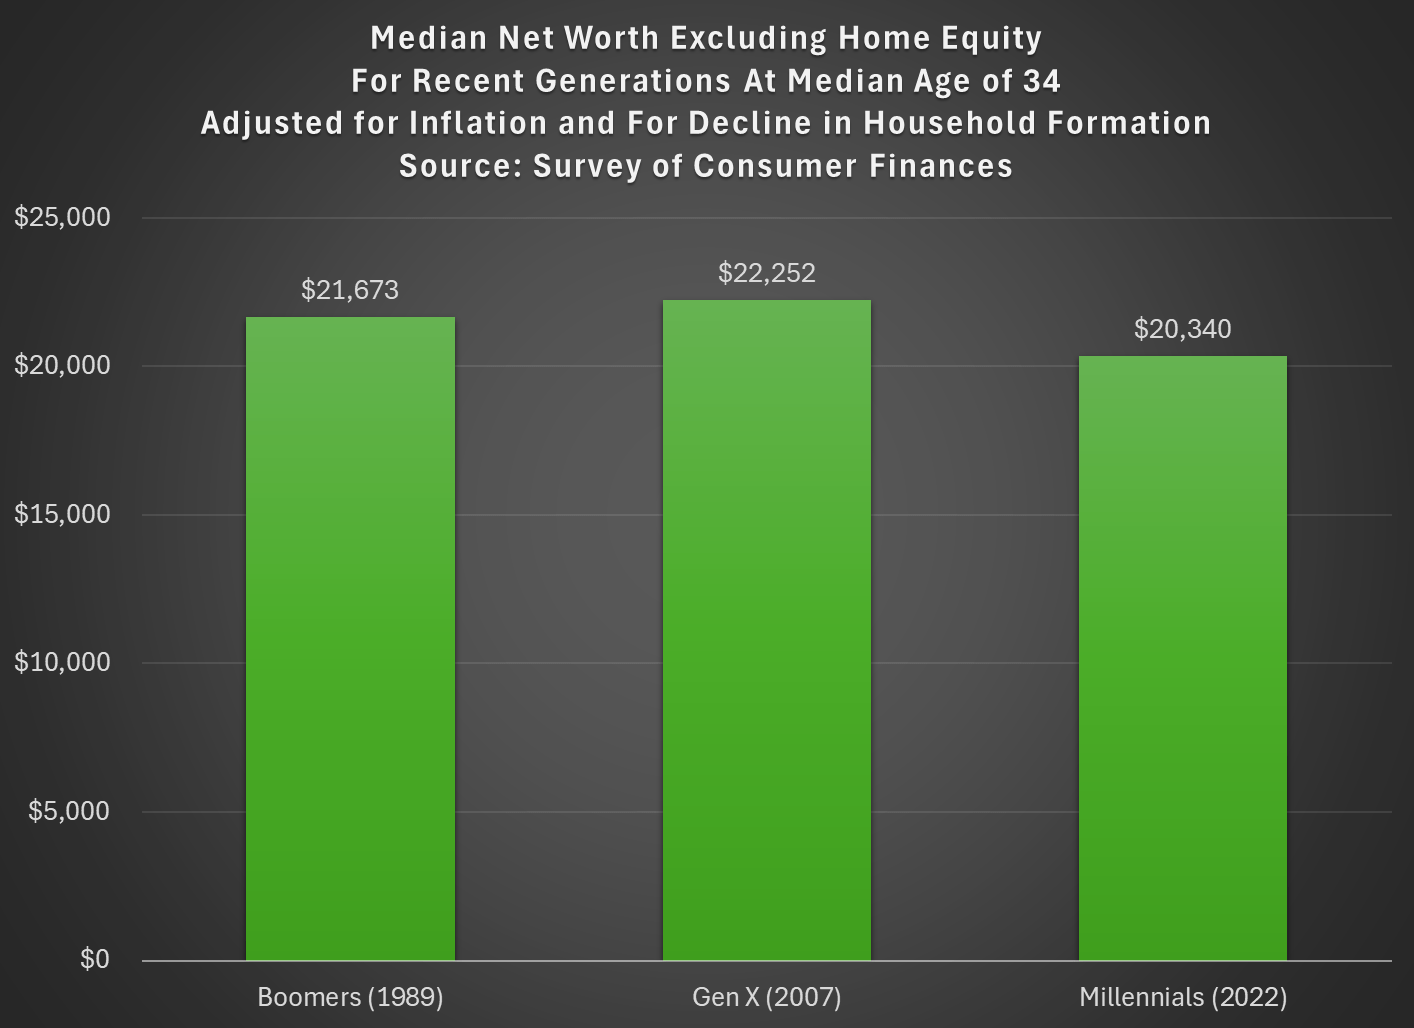
Last week I tried to address whether rising wealth for younger generations was primarily driven by rising home values. My analysis suggested that it was a cause, but not the only cause. Here’s another chart on that topic, showing median net worth excluding home equity for recent generations:

Two things are notable in the chart. For millennials, even excluding home equity they are well ahead of past generations, though of course their net worth is much smaller excluding this category of wealth (the total median net worth for millennials in 2022 was $93,800). But for Gen X in 2022 (last data in that chart), they are slightly behind Boomers, never having recovered from the decline in wealth after 2007 (primarily from the stock market decline, since we’re excluding housing).
But today I want to address another general objection to the wealth data found in the Fed’s SCF and DFA programs. That objection has to do with household formation. Specifically, these surveys are calculated for households, and the age/generation indicators are for the household head (or “householder” as it is now called). And we know that household formation has been declining over time, as more young people live with parents, with roommates, etc. So the Millennial data we see in the chart above is excluding any Millennials that have not yet formed their own household.
Here’s a general picture of the decline, which has been happening gradually since about 1980. Note: I use the age group 26-41, because this is the age of Millennials in 2022 (the most recent SCF survey year). The highlighted years on the chart are when the Silent, Baby Boomer, Gen X, and Millennial generations were about the same age (26-41).
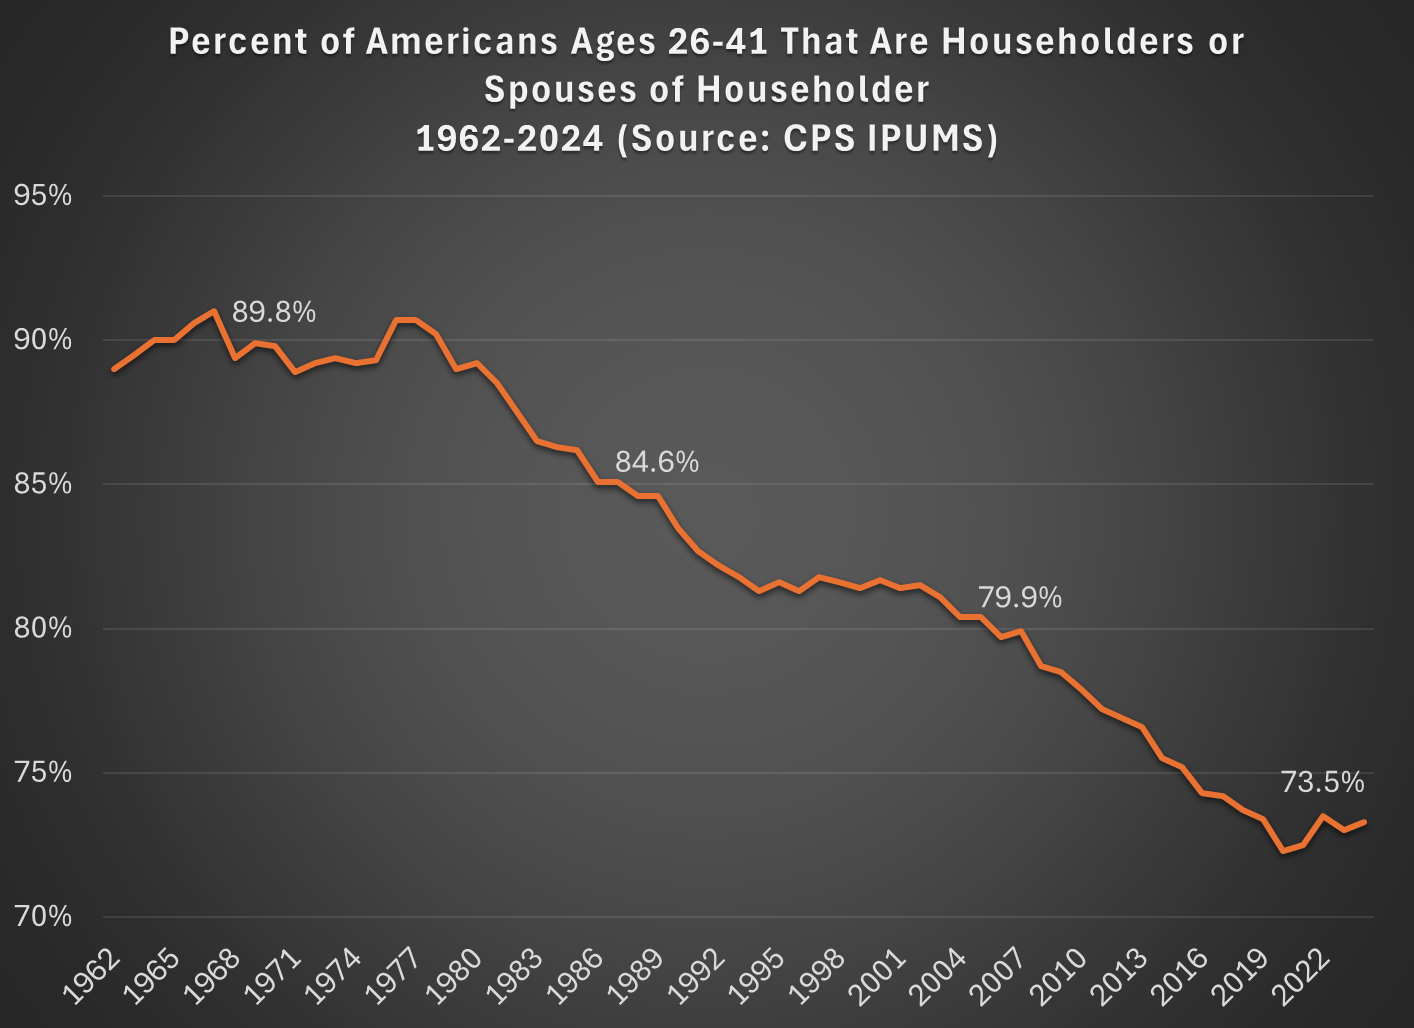
What this means is that when we are looking at households in these wealth surveys (or any survey that focuses on households) we aren’t quite comparing apples to apples. Does this mean the surveys are worthless? No! With the microdata in the SCF, we can look at not only the median value, but the entire distribution. Since the household formation rate has fallen by about 11 percentage points between Boomers in 1989 and Millennials in 2022, one solution is to look up or down the distribution for a rough comparison.
For example, if we assume all of the 11 percent of non-householders among Millennials have wealth below the median, we can make a rough correction by looking at the 39th percentile for Millennials — the 39th percentile would be the median if you included all of those 11 percent of non-householders as households. Similarly, for Gen X would move down 5 percentage points in the distribution to the 45th percentile in 2007.

The household-formation-adjusted chart does paint a more pessimistic picture than just looking at the median for each generation: the 39th percentile Millennial has about 20% less wealth than the median Boomer did at roughly the same age. Seems like generational decline! Is there any silver lining?
First, you should interpret the chart above as a worst case scenario for Millennial wealth. It assumes all non-householders have low wealth. But likely not all of them do. If instead we use the 43rd percentile of Millennials in 2022, their net worth is $61,000, slightly above Boomers at the same age. (The household formation problem isn’t going away anytime soon as generations age — even if we look at Gen Xers, with a median age of 50 in 2022, their household formation is still 6 percentage points behind Boomers at that age.)
Second, my worst case scenario almost certainly overstates the problem. If all of those 11 percent fewer Millennials not yet forming households were to get married to other millennials, it would only add half of that many households to the aggregate distribution (when two non-householders get married, it becomes one household). So instead of moving down 11 percentage points to the 39th percentile, we should only move down 5 or 6 percentiles. The 44th percentile of Millennial net worth in 2022 was $63,060 — again, compare this to Boomers in the chart above.
Finally, if we combine both of the adjustments discussed in this post, looking at wealth excluding home equity and also adjusting for the decline in household formation, we get the following chart (here I once again use the 39th percentile for Millennials and the 45th percentile for Gen X, i.e., the worst case scenario):
With this final adjustment, we get a slightly different picture. The wealth of these three generations is roughly the same at the same age. No increase in wealth, but no decline either. You could read this as pessimistic, if your assumption is that wealth should rise over time, but the general vibes out there are that young people are worse off than in the past. This wealth data suggests, once again, that the kids are doing all right.
