In aggregate, consumer spending on different broad categories of goods is relatively stable. The year 2019 feels like forever ago – and it was more than half a decade ago. But since then we’ve been hit by a pandemic and an AI shock and a trade war, and tariffs, and… plenty. We live in different times. Except, broadly, consumers are spending their money much as they did six years ago. Let’s compare some data from the 2nd quarter of 2019 and 2025.
First the Spending
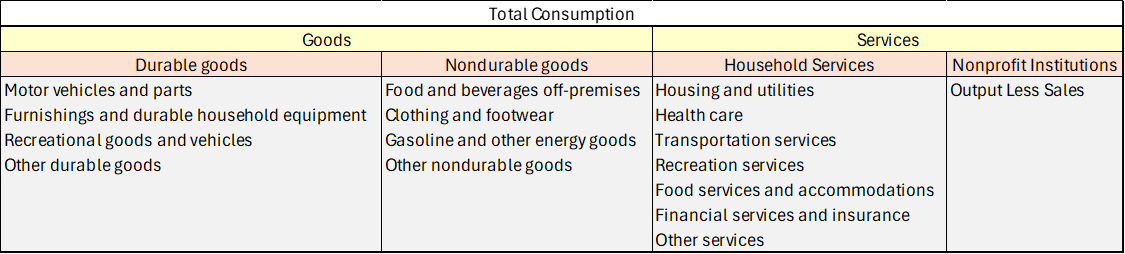
Consumption spending is categorized in the below table.
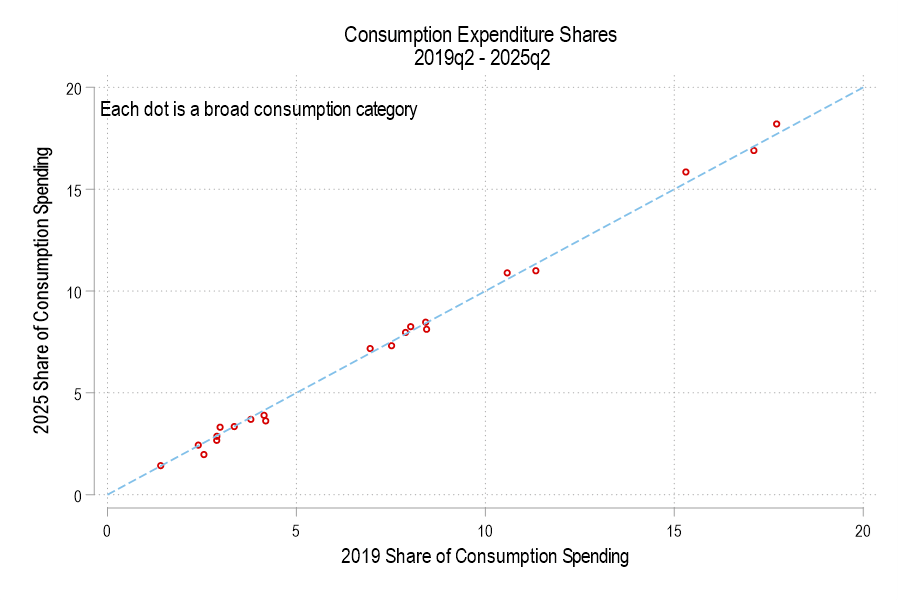
If total consumption spending (not inflation-adjusted) is 100%, then how has the allocation of spending changed? Below is a graph comparing each consumption component’s 2019 share versus 2025. The dotted line denotes an identical share. I haven’t labeled the categories because, suffice it to say, that spending shares are little different. None is more than one percentage point different.
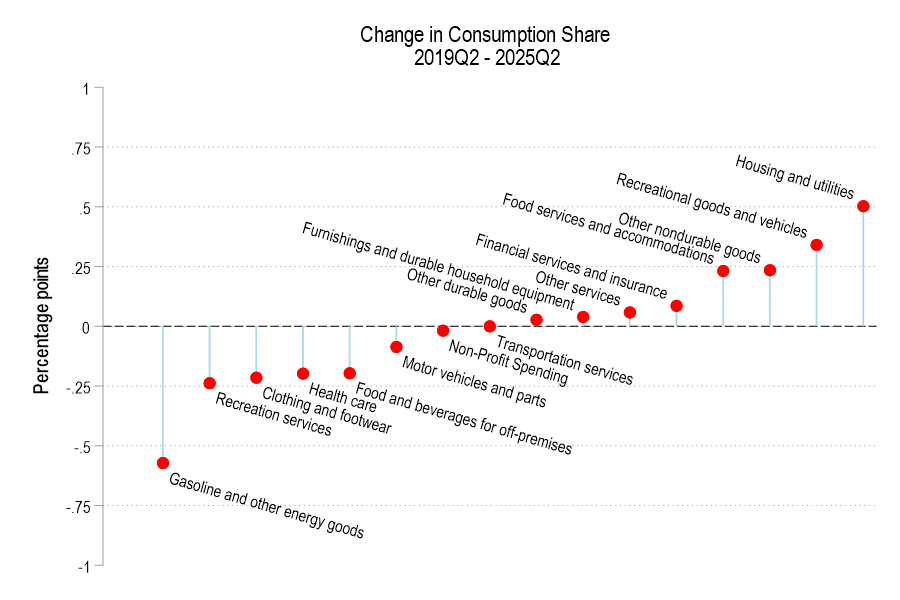
The below figure displays the spending share difference. We’re spending less of our consumption on gasoline and the like, recreational services, and clothing. Surprisingly, we’re also spending less on healthcare and food for off-premises consumption (non-restaurants). However, we’re spending a greater share on housing, recreational goods, food services for on-premises consumption (restaurants).