This post illustrates a couple of things that I learned this year with an application in finance. I learned about the simplex when I was researching amino acids. I learned some nitty-gritty about portfolio theory. These combined with my pre-existing knowledge about game theory and mixed strategy solutions.
Specifically, I learned a way of visualizing all possible portfolio returns. This post narrowly focuses on 3 so that I can draw a picture. But the idea generalizes to many assets.
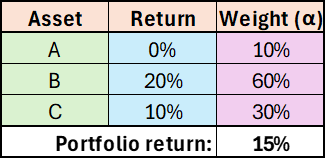
Say that I can choose to hold some combination of 3 assets (A, B, & C), each with unique returns of 0%, 20%, and 10%. Obviously, I can maximize my portfolio return by investing all of my value in asset B. But, of course, we rarely know our returns ex ante. So, we take a shot and create the portfolio reflected in the below table. Our ex post performance turns out to be a return of 15%.
That’s great! We feel good and successful. We clearly know what we’re doing and we’re ripe to take on the world of global finance. Hopefully, you suspect that something is amiss. It can’t be this straightforward. And it isn’t. At the very least, we need to know not just what our return was, but also what it could have been. Famously, a monkey throwing darts can choose stocks well. So, how did our portfolio perform relative to the luck of a random draw? Let’s ignore volatility or assume that it’s uncorrelated and equal among the assets.
Visualizing Success with Two Assets
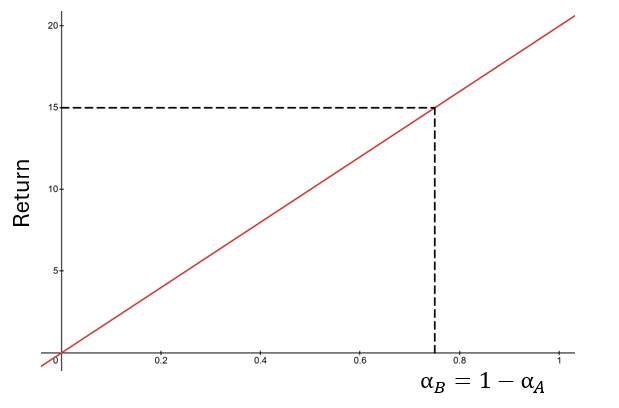
Say that we had only invested in assets A and B. We can visualize the weights and returns easily. The more weight we place on asset A, the closer our return would have been to zero. The more weight that we place on asset B, the closer our return would have been to 20%.
If we had invested 75% of our value in asset B and 25% in A, then we would have achieved the same return of 15%. In this two-asset case, it is clear to see that a return of 15% is better than the return earned by 75% of the possible portfolios. After all, possible weights are measures on the x-axis line, and the leftward 75% of that line would have earned lower returns. Another way of saying the same thing is: “Choosing randomly, there was only a 25% that we could have earned a return greater than 15%.”
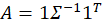
Previously, I plotted the possible portfolio variances and returns that can result from different asset weights. I also plotted the efficient frontier, which is the set of possible portfolios that minimize the variance for each portfolio return.* In this post, I elaborate more on the efficient frontier (EF).
To begin, recall from the previous post the possible portfolio returns and variances.
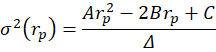
From the above the definitions we can see that the portfolio return depends on the asset weights linearly and that the variance depends on the asset weights quadratically because the two w terms are multiplied. Since the portfolio return can be expressed as a function of the weights, this implies that the variance is also a quadratic function of returns. Therefore, every possible portfolio return-variance pair lies on a parabola. So, it follows that every pair along the efficient frontier also lies on a parabola. Not every pair lies on the same parabola, however – the efficient frontier can be composed on multiple parabolas!
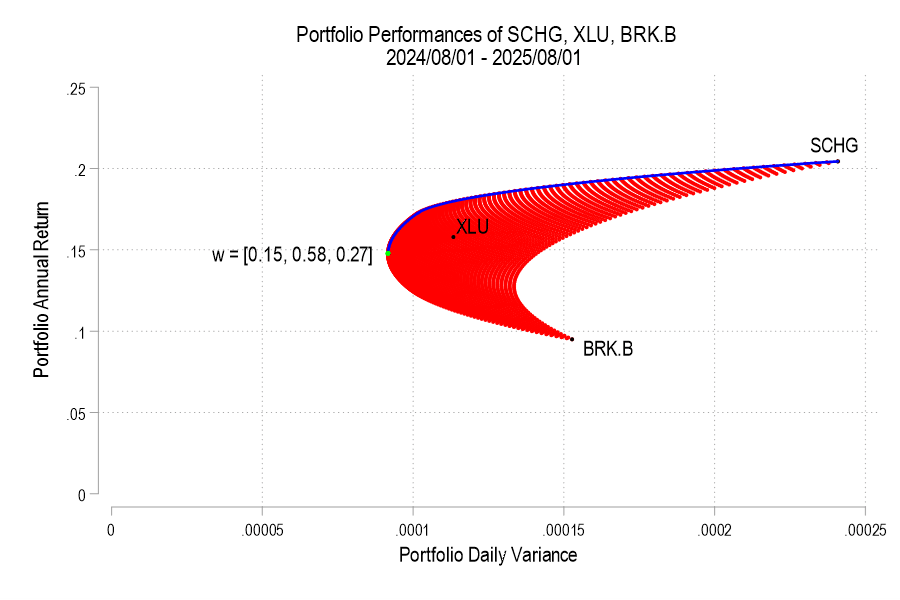
I’ll use the same 3 possible assets from the previous post, below is the image denoting the possible pairs, the EF set, and the variance-minimizing point.
One way to find the EF is to calculate every possible portfolio variance-return pair and then note the greatest return at each variance. That’s a discrete iterative process and it definitely works. One drawback is that as the number of assets can increase the number of possible weight combinations to an intractable number that makes iterative calculations too time consuming. So, we can instead just calculate the frontier parabolas directly. Below is the equation for a frontier parabola and the corresponding graph.
Notice that the above efficient frontier doesn’t appear quite right. First, most obviously, the portion below the variance-minimizing return is inapplicable – I’ve left it to better illustrate the parabola. Near the variance-minimizing point, the frontier fits very nicely. But once the return increases beyond a certain level, the frontier departs from the set of possible portfolio pairs. What gives? The answer is that the parabola is unconstrained by the weights summing to zero. After all, a parabola exists at the entire domain, not just the ones that are feasible for a portfolio. The implication is that the blue curve that extends beyond the possible set includes negative weights for one or more of the assets. What to do?
As we deduced earlier, each pair corresponds to a parabola. So, we just need to find the other parabolas on the frontier. The parabola that we found above includes the covariance matrix of all three assets, even when their weights are negative. The remaining possible parabolas include the covariance matrices of each pair of assets, exhausting the non-singular asset portfolios. The result is a total of four parabolas, pictured below.
Back in February, 2023 I wrote an enthusiastic plug for including managed futures funds in an investment portfolio. That was based on several observations. First, bonds have become often positively correlated with stocks, so the traditional 60/40 stock/bond portfolio provides less hedging or diversification than earlier. Second, during the long grinding bear market of Jan-Oct 2022, managed futures funds shot up, nicely hedging stocks. Third, I had only recently discovered managed futures, so they were for me a shiny new toy.
Managed futures funds hold both long and short positions in futures contracts for a variety of commodities (e.g., oil, gas, metals, cattle), stocks (e.g., domestic vs. international) and other financial instruments (domestic and foreign bonds, currencies, interest rates, etc.). Fund managers usually base their positioning on momentum or trend-following. Historical data shows that if a commodity moves up steadily for, say, a month, there is greater than 50% odds that it will continue moving up for some additional time. If the fund’s positioning is correct, it makes money the next week or month. If it is incorrect, the fund loses money.
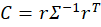
Historically, a good managed futures fund will trade fairly flat or slightly up during a stock bull phase, then step up to give positive return during a stock bear market, to counter the drop in equities prices. We can see below how that worked for managed future (MF) ETF KMLM around 2022. It rose slowly in 2021, then fell back at the end of the year. However, in Jan-Oct 2022 while stocks (and bonds) were painfully grinding down to a 22% loss, KMLM ripped higher by a huge 40%. That seems like a great hedge:
KMLM quickly gave back those gains, for reasons we will discuss. But if you had been consistently rebalancing your portfolio, you would have captured much of those gains.
This sort of performance is why some advisors recommend moving much of your non-stock holdings out of bonds and into managed futures. What’s not to like here?
It turns out that MF funds struggle if there are not fairly long, strong trends in commodity prices. If trends reverse quickly, and then reverse again, then the fund’s positions will lose money over and over. We can see this in the above plot. The story for most of 2022 was interest rates going up and up and up. MF funds were rock stars as they rode that trend for many months. But there was a surprising break in futures trends in November, 2022, as markets suddenly started pricing in an early Fed pivot towards easing in 2023, and so interest rates rose, and bonds and the U.S. dollar tumbled. All the managed futures funds took a sharp hit Nov-Dec 2022. KMLM then went roughly flat for 2023; other MF funds fared worse.
So far, so good. However, it seems like there has been a sea change in futures markets. Before around 2010 or so, there is reason to believe that much of the futures price action was driven by the underlying commodities themselves. For instance, cattle or soybean producers wanted to protect themselves against changes in cattle or soy prices, and so they would buy or sell futures to lock in prices say eight months out. In these situations, there would naturally and normally be months-long trends in futures prices. Wall Street took the other side of those trades. But now it seems to me (can’t give proof reference) that it’s speculators on both sides of the trades, leading to trade algos constantly trying to outguess each other and higher volatility.
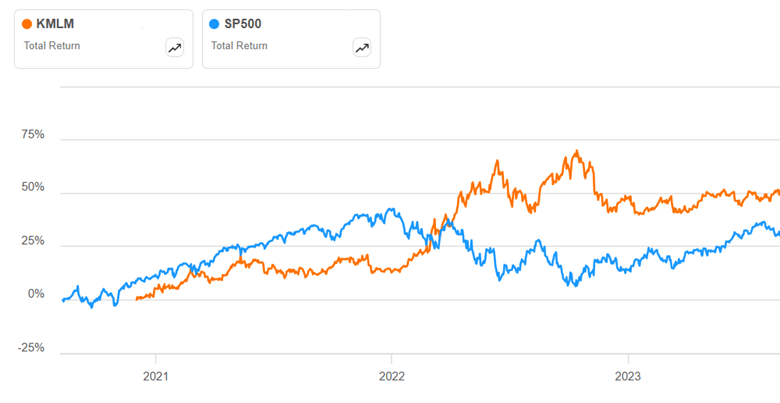
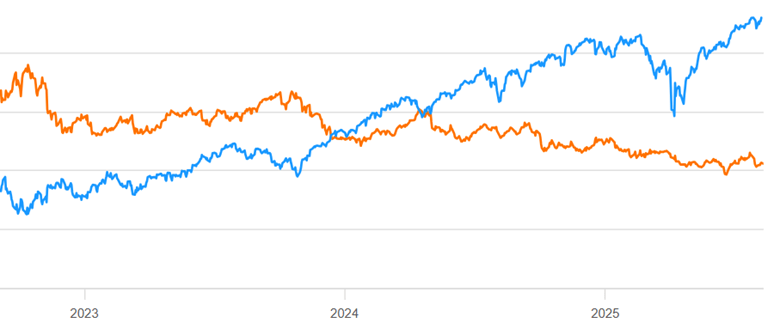
For whatever reason, normal trend-following MF has been a bad business for the past 2 years. Here is a continuation of the chart above, showing mid Aug 2023- mid Aug 2025 for KMLM (orange line) compared to S&P 500 stocks (blue line):
The scale is not shown here, but KMLM lost some 30% of its value during that time period. That is NOT the kind of hedge you want to hold.
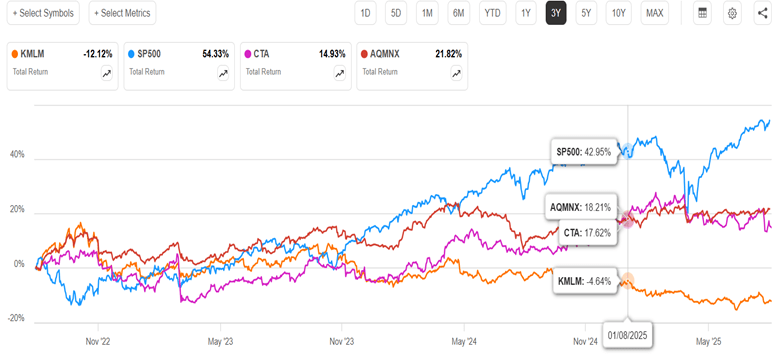
So, should we forget about MF funds? It turns out that not all MF funds perform the same. My informal research suggests that most MF funds have performed similar to KMLM in the past two years (=abysmally). Since my 2023 article, though, (a) an improved MF ETF (CTA) has appeared, and (b) I became aware of a superior MF fund (AQMNX) of the old-style (non-ETF) mutual fund format. Below is a 3-year chart of KMLM, SP500, and the ETF CTA and the mutual fund AQMNX:
We can see that both the new contenders are up instead of down in the past three years, and both were uncorrelated enough to SP500 to cushion the big Feb-April stock drawdown this year. They handily outperformed bonds (e.g. BND, not shown) during this time period.
There are fundamental reasons why those two funds would behave differently than plain vanilla trend-following KMLM. CTA adds a factor called carry (which I will not try to define) to its algo, and also takes large concentrated bets. AQMNX draws on the very sophisticated quantitative resources of the AQM fund family. It also takes long/short bets on equities (e.g. S&P 500 index), which are not in KMLM. AQMNX is not available through all brokerages (it is at Fidelity).
As the months roll by and plain stocks soar effortlessly up and up, it may seem pointless to consider any portfolio hedges. But for those who value diversification, these two funds may merit consider consideration. (As usual, nothing here should be considered advice to buy or sell any security).
Over the winter break I was able to catch up on a lot of podcasts. I also began listening to the Marginal Revolution podcast (which is phenomenal). I especially enjoyed the final episode of season 1 about options and how many transactions can be characterized as giving someone an option. Here, the term option echoes a financial option. You pay today for the ability to do something in the future. In financial markets, you can purchase the right to buy or sell at a particular price in the future.
But lots of things count as options. Staying in the financial context, purchasing a stock gives you the option to sell that stock at the future spot price. So, in this way, something can be characterized as an option even though we are not accustomed to describing as such explicitly. More mundane transactions can also be interpreted as options. Assume that you buy a can opener. You are buying the option to have that tool on hand in the future and to open some shelf-stable food. You can choose to exercise the option simply by opening your kitchen drawer.
But financial options often include the possibility of losing money. It may be that your grocery purchases never include canned items and that you never have occasion to use your can opener. Maybe that’s a bad investment. You sunk your money into something that you never used. Except… You did in fact have the option to use the can opener. Maybe you had peace of mind that you were well prepared just in case a guest arrived with a can of something. Buying a can opener is like buying an option.
Returning to the realm of finance, let’s discuss buying on margin. Buying an asset on margin is when you borrow from your broker in order to purchase a financial asset. It’s not entirely free money. They have rules about the amount you can borrow and, of course, you must pay back the loan with interest.
This post is to share some observations that may be helpful to readers who, like me, were rudely surprised by the simultaneous steep decline in both bonds and stocks in the past year.
Bonds and Stocks Are No Longer Inversely Correlated
Back in the day before routine, massive Federal Reserve interventions, say before the 2008 Great Recession, there was a more or less routine business cycle. In an expansionary phase, GDP would increase, there was greater demand for loans, company profits would rise and so would stock prices and interest rates. When interest rates go up, bond prices go down. When the cycle rotated to the recessionary downside, all this would reverse. Stocks would go down, interest rates would decline and investors would flee to bonds, raising their prices.
Thus, bonds served as a good portfolio diversifier, since their prices tended to move inversely to stocks. Hence, the traditional 60/40 portfolio: 60% stocks, 40% bonds, with periodic rebalancing between the two classes.
This approach still worked sort of OK from 2008-2021 or so. The Fed kept beating interest rates lower and lower, and so bond prices kept (fitfully) rising. But at last we hit the “zero bound”. Short- and long-term interest rates went to essentially zero in the U.S. (and actually slightly negative in some other developed countries). Rates had nowhere to go but up, and so bond prices had no place go but down, no matter how stocks performed.
Trillions of dollars of federal deficit spending to pay out various COVID-related benefits in 2020-2021, along with supply chain interruptions, ignited raging inflation in 2022, which the Fed belated addressed with a series of rapid rate hikes and reductions in its bond holdings. The end of easy (nearly no-interest) money and the prospect of a recession knocked stock prices down severely in 2022. However, the rise in both short term and long term interest rates also cratered bond prices. The traditional 60/40 portfolio was decimated. Thus, in an inflationary environment with active Fed intervention, bonds are much less useful as a portfolio diversifier.
Both the stock and bond markets seem to be now driven less by real-world considerations and more by expectations of Fed (and federal government) reactions to real-world occurrences. Pundits have noted the “bad news is good news” effect on stock prices: if GDP dips or unemployment rises (which used to be considered recessionary bad news), the markets cheer, assuming that if any real economic pain occurs, the federal government will flood us with benefits and the Fed will lower rates and buy bonds and otherwise facilitate the renewed deficit spending. (See The Kalecki Profit Equation: Why Government Deficit Spending (Typically) MUST Boost Corporate Earnings for an explanation of why deficit spending normally causes a rise in corporate profits, and hence in stock prices.)
In 2022, there was practically no place to hide from investment losses. Petroleum-related stocks furnished one of the few bright spots, but that was partly a function of economies recovering that year from COVID lockdowns. There is no particular reason to believe that petroleum stocks will rise in the next market downturn. Oil and gas stocks, along with gold and other commodities, might offer a certain degree of diversification, but none of these can be assumed to normally rise (or even stay steady) when the general stock market falls.
Managed Futures Funds as Portfolio Diversifiers
It turns out that there is one class of investable assets that does tend to rise during an extended market downturn, while typically rising slowly or at least staying level during stock bull markets. That is managed futures funds. These funds observe pricing trends across a wide range of commodities and currencies and bond markets, and buy or sell futures to try to profit. If they (or their algorithms) guess right, they make steady, small gains. If there is a new, strong trend that they can buy into, they can make a lot of money quickly. Such was the case for most of 2022. It was obvious that the Fed was going to raise rates heavily that year, which would drive up interest rates and the value of the dollar versus other currencies, and would crush bond prices. The managed futures funds shorted the Euro and bonds, and made a ton of money January-November last year. Investors who held these funds were glad they did. Charts to follow.
The first chart here shows the total returns for the S&P 500 stock index (blue) and a general bond fund, BND (purple), for the past three years, ending Feb 13, 2023. (Ignore the orange curve for the moment). This chart captures the short but very sharp drop in stock prices in early 2020, as COVID lockdowns hit, but government aid was promised. Bonds did not greatly rise as stocks fell then, although after a bit of wobble they stayed fairly steady in early 2020. However, when stocks slid down and down during most of 2022, bonds went right down with them (purple drawn-in arrow), giving no effective diversification. Both stocks and bonds rose in early 2023, showing what is now a positive correlation between these two asset classes.
The next chart (below) omits the bonds line, showing just the blue stocks curve and the orange curve, which is for a managed futures fund, DBMF. The drawn-in red arrows show how DBMF only dipped a little during the COVID crash in early 2020, and it rose greatly in 2022, as stocks (blue arrow) collapsed. This shows the power of managed futures for portfolio diversification.
There was a surprising break in futures trends in November, 2022, as markets suddenly started pricing in an early Fed pivot towards easing in 2023, and so interest rates rose, and bonds and the U.S. dollar tumbled. All the managed futures funds took a sharp hit Nov-Dec 2022; some of them recovered better than DBMF, which kept drifting down for the next few months. Without getting too deep in the weeds, DBMF is an exchange-traded fund (ETF) with favorable fees and taxation aspects for the average investor. However, its holdings are chosen by observing the recent (past few weeks) behavior of other, primary managed futures funds, and trying to match the average performance of these funds. Some of these other, similar funds are EBSIX, PQTNX, GIFMX and AMFNX. These are mutual funds, rather than ETFs, with somewhat higher fees and higher minimum purchases, depending on which “class” of these funds you go with (A, C, or I).
This average matching technique is good, because the performance of any single one of the major managed futures funds can be really good or really any particular year. Some of these individual funds have done consistently horribly, so you’d be in bad shape if you happened to pick one of those. But the average of all those funds, as quantified by a relevant index, does OK and so does DBMF. However, as observed by Seeking Alpha author Macrotips Trading, because of its backwards-looking matching methodology, DBMF can be appreciably slower than other funds to adjust its positions when trends change. KMLM is another managed futures ETF, which tends to be more volatile than DBMF; higher volatility may be desirable for this asset class.
One Fund to Rule Them All
A recommended application of these managed futures funds is to replace maybe a third of your 40% bond holdings with them. Back testing shows good results for say a 15 managed futures/25 bonds/ 60 stocks portfolio, which is periodically rebalanced.
What if there was a fund which combined stocks and managed futures under one wrapper? There is one I have found, called REMIX. It has an “institutional” class, BLNDX, with higher minimum purchase and slightly lower fees, which I have bought into. The chart below shows the past three years of performance for the hybrid REMIX (orange) compared to stocks (blue) and the managed futures-only fund DBMF. We can see that REMIX stayed fairly flat during the COVID blowout in 2020, and it rose along with stocks in 2021, and went roughly flat in 2022 instead of dropping with stocks (see thick drawn-in yellow arrows). The performance of REMIX is actually better than a plain average of stocks (blue curve) and DBMF (purple), so this is an attractive “all-weather” fund. A similar hybrid (multi-asset) fund is MAFCX, which has higher fees but perhaps slightly higher returns to date. MAFCX buys stock (S&P500) futures rather than the stocks themselves, which is a leveraged play – – so for $100 investment in MAFCX you get effectively $100 worth of managed futures plus $50 worth of stock investment.
Managed futures put in an outstanding performance in 2022 because there was a well-telegraphed trend (Fed raising interest rates) in place for many months, which allowed them to make easy profits at the same time that stocks were crashing. But we cannot assume that managed futures will always go up when stocks go down. That said, managed futures will likely be reasonable diversifiers, since they should at least stay roughly level when stocks go down. The trick is to not grow impatient and dump them if their prices stagnate during a long bull stock market phase. Holding them in the form of a multi-asset fund like REMIX may help investors hang in there, since it should go up in a bull market (due to its stock component), while offering protection in a bear.
For instance, below is a five-year chart of a managed futures fund ( EBSIX, purple line ), the S&P 500 stock index (blue line), and a multi-asset fund that combines stocks and managed futures ( MAFIX, orange line. This is the institutional version of MAFCX). The charting program did not account properly for the Dec 2022 dividend of MAFIX, so I extended its curve with a short red line at the right-hand side to show what it should look like if plotted on a consistent total return basis.
With perfect hindsight, I chose a managed futures fund (EBSIX) which has performed among the best over the years; many other such funds would have looked far worse. There was a period of nearly two years (mid-2020 -early 2022) when this fund lagged far behind stocks. It was only when the 2022 catastrophe arrived that the managed future fund EBSIX proved its worth and shot up. The multi-asset fund MAFIX, which is similar to REMIX but with higher fees, basically kept up with stocks in their bull phase, then held more or less steady for 2022, and ended much higher over five years than either SP500 or the plain EBSIX.