Here we discuss some stock funds that go down less than stocks in general; the flip-side is that they go up less than plain stocks, as well. Some investors may appreciate the reduction in gyrations, especially after a week like the previous one.
Long-short funds come in two main flavors. When you buy a stock, that is considered being “long”. If you short-sell a stock (borrow shares from some broker, that you plan to pay market price for later, such that you make roughly one dollar for every dollar the stock goes down), that is being short.
“Equity-neutral” funds are short as much value of stocks as they are long. So, they are net 0% long. Obviously, you would expect the value of such a fund to not decline much in a market crash. But conversely, it would not go up much in a bull market, either. So how is this better than just holding cash in your account? The magic is if the active fund managers can manage to be long a set of stocks which go up more than the stocks that they short. They often try to pair longs and shorts in the same sector. For instance, in 2024 if a fund was long Nvidia and short Intel (another stock in the semiconductor sector), that would have been a big net win. Sometimes this works, and sometimes it doesn’t.
The actual performance of such a fund is very dependent on the active managers’ skill and luck. For instance, here is a ten-year total return plot of two market-neutral funds, one from AQR and the other from Vanguard. The Vanguard fund (VMNIX) muddled along pretty flat from 2015 through 2021, then had a slow rise 2021-2023, then went flat again. The performance of the AQR fund (QMNNX) has been more erratic. It went up 2015-2017, then down a lot (this would have been hard to bear at the time, when the S&P was roaring upward) for 2018-2020. It then roughly matched the Vanguard fund for a couple of years, then pulled way ahead 2023-2025, as it made some great long/short choices:

However, the ten-year performance of these funds fell far short of a simple S&P500 holding (blue line above). Since stocks go up the vast majority of the time, a long-short fund which is net long seems to make more sense.
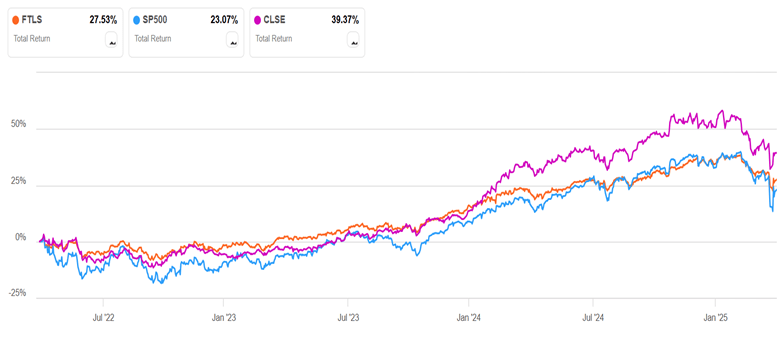
A plain vanilla net-long long-short fund is FTLS. It seems to be among the best of the long-short ETFs. It is usually about 60% net long. I modeled its performance against a portfolio of 60% S&P 500 stocks and 40% cash (rebalanced periodically), and it performed about the same. That is, FTLS went up and down with moves about 60% of what the S&P did. That is OK, but one might wonder why one would hold such a fund instead of just holding a 60/40 stocks/cash allocation for the same amount of investment. If we look at time periods with appreciable down periods, such as the past three years (see chart below), FTLS does look comforting; its muted dips in 2022 and 2025 compensate for its slower rise in 2023-2024, so it presents as a slow, fairly steady rise with a 3-year total return slightly higher than S&P. It is certainly easier psychologically to hold such a fund, and it might help small investors avoid the deadly mistake of panic-selling during a market downturn.
CLSE is a long-short fund that is often about 70% long. Management there takes a more swashbuckling, risk-taking approach. It went down less than S&P in the bear market of 2022 (as expected), and then it soared high above S&P in the first half of 2024, as it made skillful/lucky picks to go very long tech growth stocks like NVDA. That tech-heavy approach has backfired so far in 2025, since CLSE has fallen as much as S&P in the past several months (NOT what one hopes for a long-short fund). Despite that glitch, however, CLSE still weighs in with a 3-year return far ahead of the broader S&P (39% vs. 23%):
Another strategy to mitigate market ups and downs is for a stock fund to buy and sell put and call options, to create a “collar” effect. Buying puts limits the downward movements; the puts are financed by selling calls, which limits the upward swings. The fund ACIO, for instance, seeks to capture 65% of the S&P’s upside, while limiting loss to 50% of the downside. In my stock charting, I found it ended up performing about like FTLS. As of a week ago (Tue, Apr 8), the S&P was down 15% year to date (i.e., since Jan 1), while FTLS and ACIO were only down 8.3 % and 9.6%, respectively.
Standard Disclaimer: This is for information only. Nothing here is advice to buy or sell any security.
