Despite recent increases in prices of food, we should still all be very thankful this Thanksgiving for the abundance of affordable food available in the modern world. Looking back at my past few blog posts, I notice that I have been very food-centric in my choice of topics! And last week I also showed how the Thanksgiving meal this year will be the second cheapest ever (only behind 2019). While it’s absolutely true that food prices are up a lot in the past 2 and 4 years, they probably aren’t up as much as you have heard.
It’s always my preference to take as long-term perspective as possible when thinking about economic progress. So here’s the best way I’ve come up with to show how cheap and abundant food is today: food as a share of household spending fell dramatically in the 20th century.
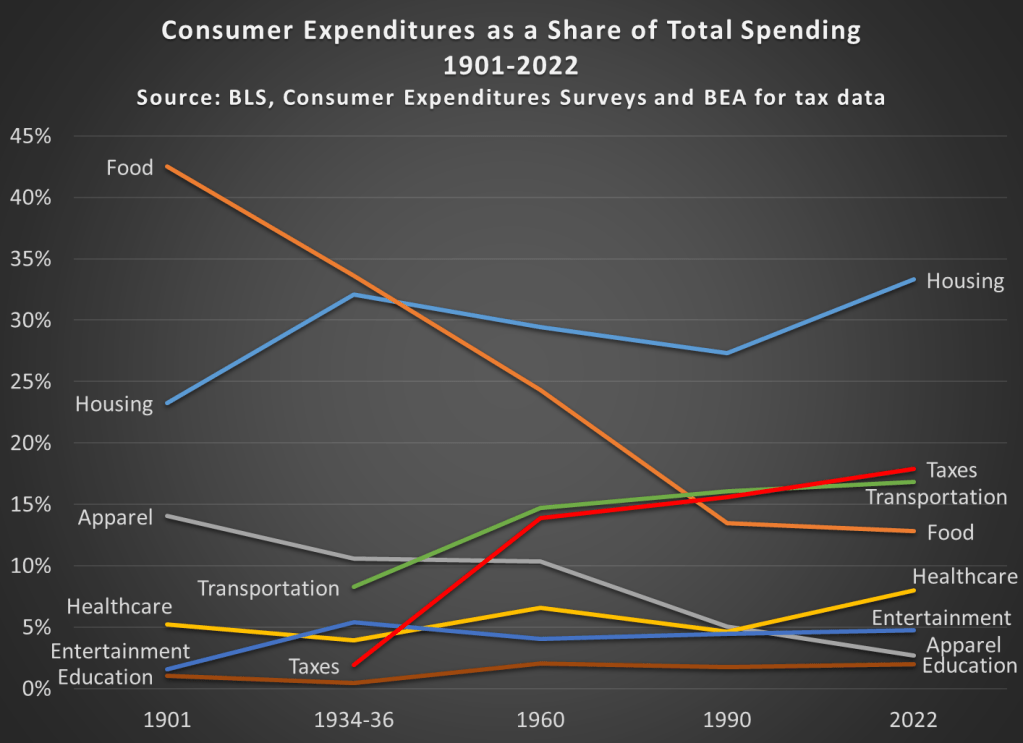
Most of the data in this chart comes from the BLS Consumer Expenditure Surveys. This survey was done occasionally since 1901, and then annually since 1984. I also use BEA data to estimate personal taxes paid as a percent of spending (the CEX Surveys have some tax data, but it’s not reliable nor consistent). I picked as close to 30-year intervals as I could (with a preference for showing the earliest and latest years available), and I chose spending categories that are 90-100% of total expenditures in most of these years. Keep in mind also that these are consumer expenditures. As a nation, we spend a lot more on healthcare and education than this chart suggests, but most of that spending is not directly from households (of course, it is indirectly). Think of this chart as an average household budget.
I hope the thing that jumps out at you is that the amount money households spend on food has fallen dramatically since 1901, from over 42 percent to under 13 percent of household expenditures. To be clear, this data includes both spending on food at home and at restaurants (after 1984 we can track them separately, and groceries are pretty consistently about 60 percent of food spending). And you may be wondering about very recent trends too, such as before the pandemic. In 2022, household spent slightly less on food than they did in 2019, falling from 13.5 to 12.8%.
You may also notice that taxes have increased, though not much since 1960. Housing cost have been consistently high, and also a bit higher than 1990, going from 27 percent to 33 percent in 2022. And housing is now the single largest budget expenditure category, but for most of the first half of the 20th century, it was food that was the largest. And since people aren’t changing their housing situation more than once a year (if that), it would also have been food that dominated weekly and monthly budget decisions and worry about price fluctuations.
This year there will be lots of complaining about prices around the Thanksgiving table. And much of that is warranted! But let’s also be thankful on this food-intensive holiday for how cheap the food is.
And if some smart-aleck youngster tries to tell you that they learned on TikTok that things were better during the Great Depression (yes, people are really saying this!), have them watch this video by Christopher Clarke. Or show them that in the mid-1930s an average family spent one-third of their budget on food in my chart above, or how much labor it would have taken to buy that turkey in the 1930s (about 40 times as much time spent working as today).

Why is Education so low?
LikeLike