Bryan Caplan explains why blogging is his favorite way to write, even as someone who has published many articles and books. It’s because of the readers:
The blog posts, finally, are the most fun. Why? Because I can quickly make an original point. When I blog, I assume that readers already understand the basics of economics, philosophy, political science, and history. Or to be more precise, I assume either that (a) readers already understand the basics, or (b) are motivated enough to self-remediate any critical gaps in their knowledge. I also assume that readers already know the basics of my outlook, so I don’t have to constantly repeat repeat repeat myself. Finally, I assume that readers already appreciate me, at least to the extent of, “You’re often wrong, but reliably interesting.” So rather than spend precious time convincing readers that I’m worth reading, I can immediately try to convince them that the thesis of my latest post is important and correct….
In the spirit of Thanksgiving, I’d like to say that I owe almost all of this to you, my dear readers. You’re the people I wake up thinking about. You’re the people I hope to excite on a daily basis. You’re my sounding board, and my confidants. I owe you, big time.
I couldn’t say it better myself, so I’ll just leave it to Bryan.
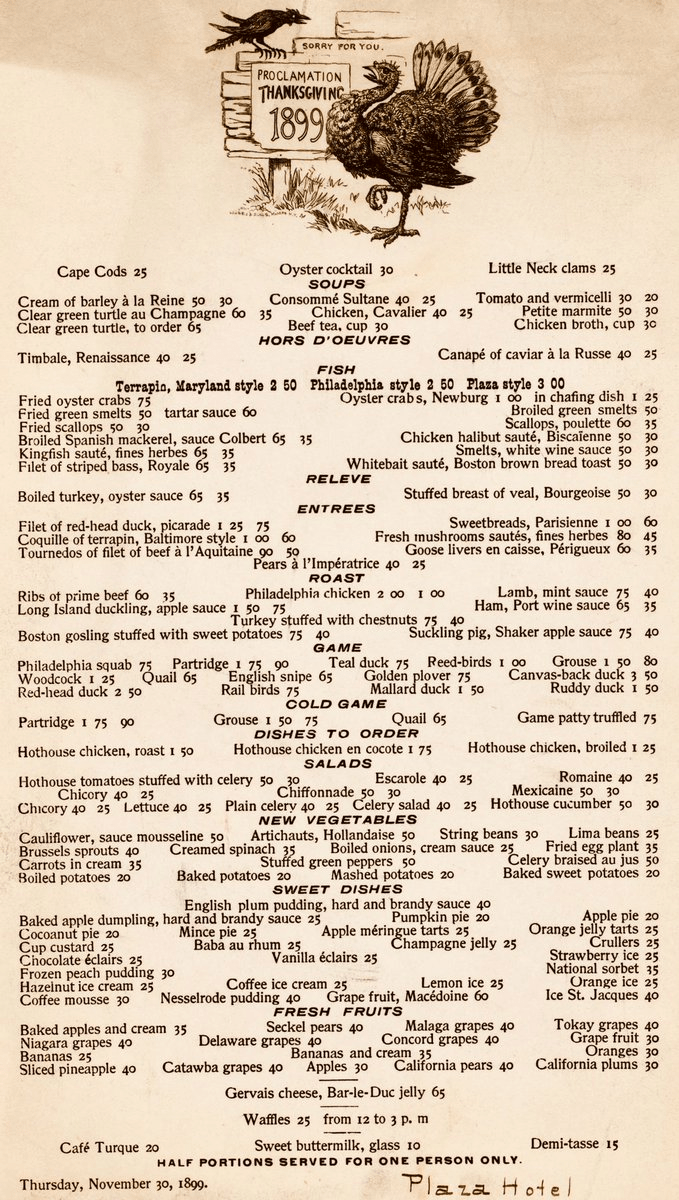
When you see prices from the past, especially the distant past, your normal reaction is perhaps one of envy or nostalgia. Take for example the Thanksgiving menu from the Plaza Hotel in New York in 1899. As you browse the menu, note that the prices are in cents, not dollars.
The most expensive items on the menu are only a few dollars, while many items can be had for around 50 cents. But hopefully your nostalgia will soon fade when you recall that wages were probably lower back then.
But how much lower?
According to data from MeasuringWorth.com (an excellent resource affiliated with the Economic History Association), the average wage for production workers in manufacturing was 13 cents per hour in 1899. From this we can immediately see that a dish such as Ribs of Prime Beef (60 cents) would take about 4.5 hours of work for a production worker to purchase.
How can we compare these prices and wages from 1899 to today?
Sometimes it’s easy to take for granted the good things you’ve always had; you don’t know what you’ve got till it’s gone.
In that spirit, after lacking it for much of the last month, I am extremely thankful for reliable indoor plumbing. Our clay sewer pipes that had lasted 100+ years finally started to crack, which made for a big mess and took $8000 to repair. But we’re now back in business, and thanks to the magic of pipe relining we didn’t have to dig through our deck to do it.
Hopefully this lets you all appreciate your plumbing too without having to go through the whole experience yourself.
Despite recent increases in prices of food, we should still all be very thankful this Thanksgiving for the abundance of affordable food available in the modern world. Looking back at my past few blog posts, I notice that I have been very food-centric in my choice of topics! And last week I also showed how the Thanksgiving meal this year will be the second cheapest ever (only behind 2019). While it’s absolutely true that food prices are up a lot in the past 2 and 4 years, they probably aren’t up as much as you have heard.
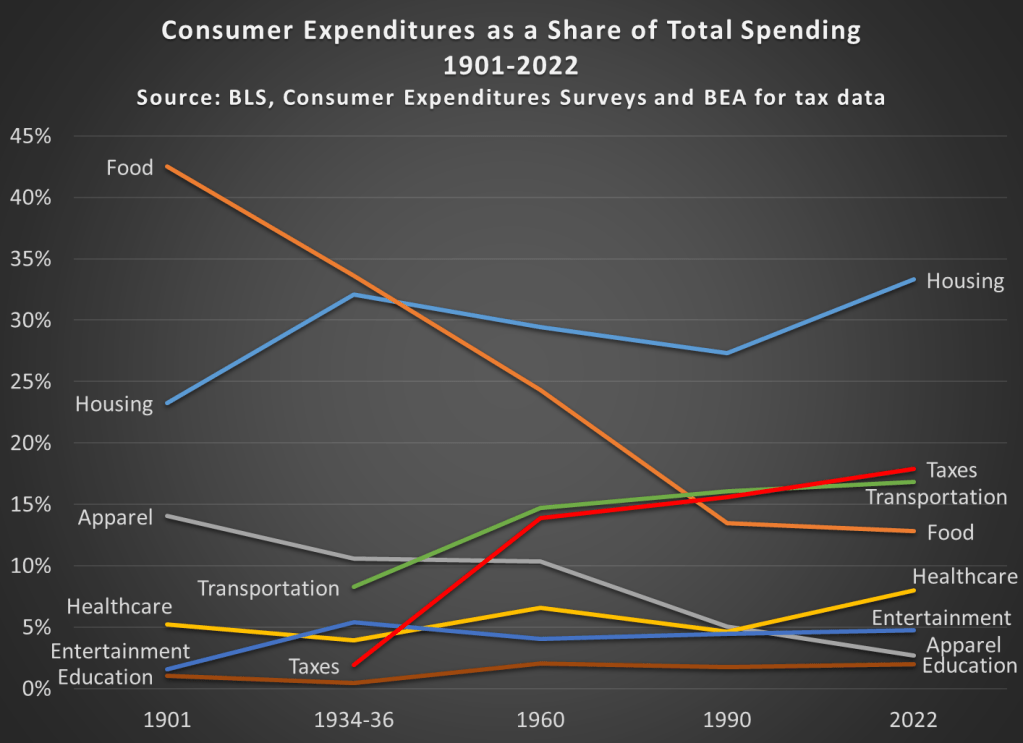
It’s always my preference to take as long-term perspective as possible when thinking about economic progress. So here’s the best way I’ve come up with to show how cheap and abundant food is today: food as a share of household spending fell dramatically in the 20th century.
Most of the data in this chart comes from the BLS Consumer Expenditure Surveys. This survey was done occasionally since 1901, and then annually since 1984. I also use BEA data to estimate personal taxes paid as a percent of spending (the CEX Surveys have some tax data, but it’s not reliable nor consistent). I picked as close to 30-year intervals as I could (with a preference for showing the earliest and latest years available), and I chose spending categories that are 90-100% of total expenditures in most of these years. Keep in mind also that these are consumer expenditures. As a nation, we spend a lot more on healthcare and education than this chart suggests, but most of that spending is not directly from households (of course, it is indirectly). Think of this chart as an average household budget.
I hope the thing that jumps out at you is that the amount money households spend on food has fallen dramatically since 1901, from over 42 percent to under 13 percent of household expenditures. To be clear, this data includes both spending on food at home and at restaurants (after 1984 we can track them separately, and groceries are pretty consistently about 60 percent of food spending). And you may be wondering about very recent trends too, such as before the pandemic. In 2022, household spent slightly less on food than they did in 2019, falling from 13.5 to 12.8%.
You may also notice that taxes have increased, though not much since 1960. Housing cost have been consistently high, and also a bit higher than 1990, going from 27 percent to 33 percent in 2022. And housing is now the single largest budget expenditure category, but for most of the first half of the 20th century, it was food that was the largest. And since people aren’t changing their housing situation more than once a year (if that), it would also have been food that dominated weekly and monthly budget decisions and worry about price fluctuations.
This year there will be lots of complaining about prices around the Thanksgiving table. And much of that is warranted! But let’s also be thankful on this food-intensive holiday for how cheap the food is.
And if some smart-aleck youngster tries to tell you that they learned on TikTok that things were better during the Great Depression (yes, people are really saying this!), have them watch this video by Christopher Clarke. Or show them that in the mid-1930s an average family spent one-third of their budget on food in my chart above, or how much labor it would have taken to buy that turkey in the 1930s (about 40 times as much time spent working as today).
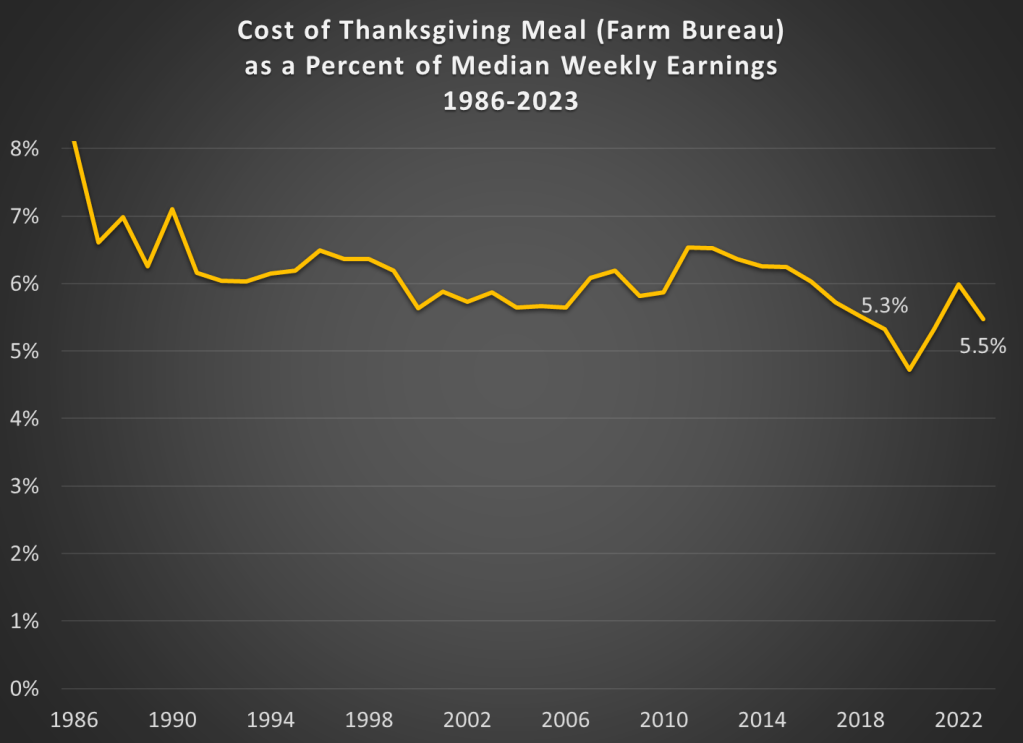
Continuing my tradition of Thanksgivingposts, Farm Bureau released today the latest data on the cost of a traditional Thanksgiving meal. There is welcome news for consumers, as the nominal price of the dinner is slightly lower than last year: $61.17 vs. $64.05 in 2022. The big factor in this decline was the fall in the price of turkeys, though eight of the 12 items in this meal are lower than 2022. As they note in the press release, this is still significantly higher than 2019: about 25% higher.
Regular readers will know what’s coming. Let’s compare those prices (and some historical prices) to earnings:
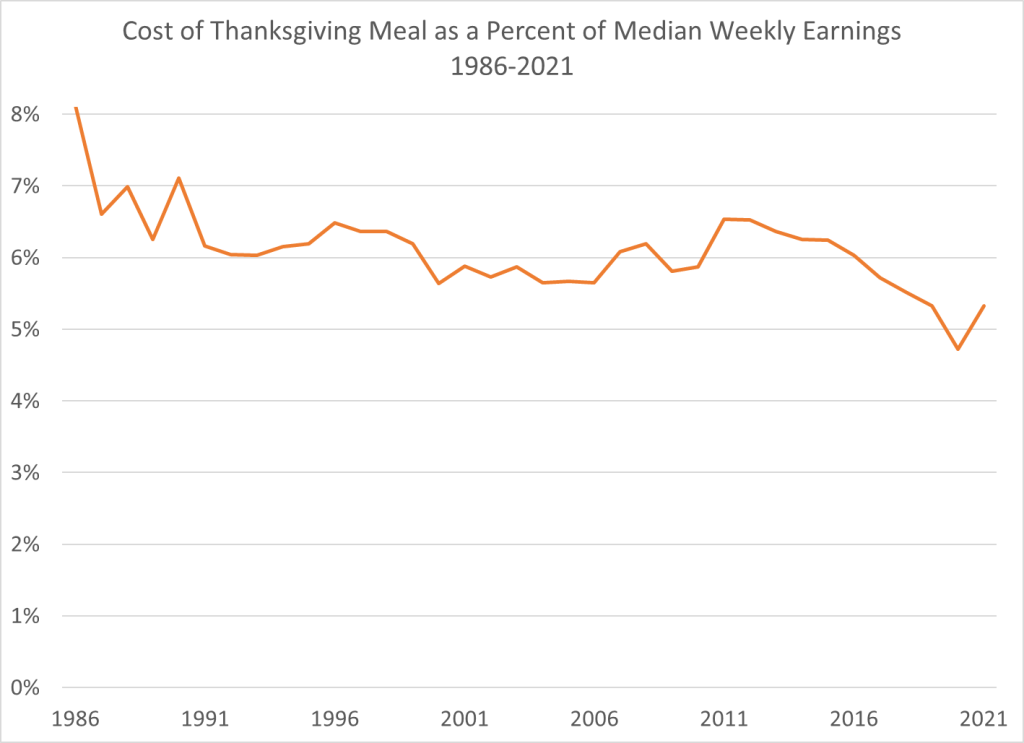
The Farm Bureau turkey dinner stands at about 5.5 percent of median weekly earnings from the third quarter of this year. That’s a touch higher than 2019, when it was 5.3 percent of weekly earnings. But notice that other than 2019, the figure for 2023 is the lowest ever! (Ignoring the weird years of the pandemic, when wage data is hard to interpret.) So we haven’t quite gotten back to 2019 levels, but we are at the same level as 2018. And lower than 2017. And all prior years too.
The last few Thanksgivings have been tough for Americans. This year, we can all be thankful for falling prices and rising wages.
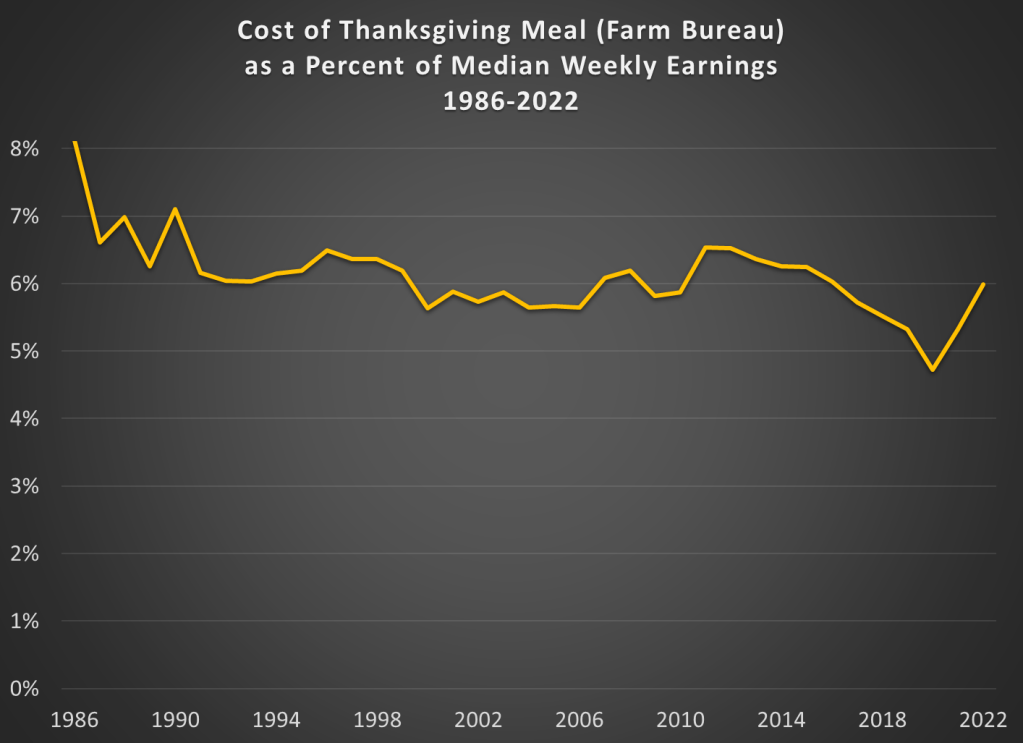
Last year inflation hadn’t quite hit the levels we would see in 2022, but they were already rising. When Thanksgiving rolled around, many media sources were reporting that it was the “most expensive Thanksgiving ever.” In nominal terms that was true, though in nominal terms it isn’t that surprising. In a post last year, I compared the prices of Thanksgiving dinners (using the same data from Farm Bureau) to median earnings going back to 1986. While 2021 was more expensive the 2020, it turned out it was still the second lowest it had been since 1986.
As you might expect, this year’s Thanksgiving dinner is even more expensive than last year in nominal terms. It’s up about 20% since last year or over $10 more, according to Farm Bureau. That’s certainly more than the overall rate of inflation (7.7% in the past 12 months) and more than inflation for groceries (12.4% in the past 12 months). But how does that compare with median wages? Comparing the 3rd quarter of this year with the same quarter in 2021, median wages are only up about 7%, certainly not enough to keep up with those rising turkey prices.
When we add 2022 to the historical chart, here’s what it looks like.
The spike in the last 2 years is clear in the chart but notice that at about 6% of median weekly earnings, we have essentially returned to the average level of the entire series. From 2017-2021, we could be thankful that the price of your Thanksgiving dinner had dropped below that 6% level. We’ll have to find something else to be thankful for this year.
In 1621 the pilgrims were starving after their communal farming system gave them little incentive to work hard, leading them to rely on the generosity of their native neighbors at the first Thanksgiving. But in the long run they were able to produce their own feasts after switching to a private property system. Economist Ben Powell tells the story briefly here, or you can read the primary source, William Bradford’s Diary here.
It is customary in many families to “give thanks to the hands that prepared this feast” during the Thanksgiving dinner blessing. Perhaps we should also be thankful for the millions of other hands that helped get the dinner to the table: the grocer who sold us the turkey, the truck driver who delivered it to the store, and the farmer who raised it all contributed to our Thanksgiving dinner because our economic system rewards them
Powell calls this “the real lesson of Thanksgiving”, and while I think there are other great angles to the story this is certainly a real lesson of Thanksgiving.
But is it true? In short: no. I’ll explain why, but my larger goal is to get you to think more clearly about inflation.
How should we measure the cost of a Thanksgiving meal? A widely used measure comes from the Farm Bureau, which shows that the cost of a traditional turkey-centric meal costs about 14% more than last year. In dollar terms it is $53.31 for a turkey, a pumpkin, cranberries, sweet potatoes, stuffing, etc. That’s more that it has ever been, in dollar terms. Farm Bureau has been tracking the cost of this same meal since 1986.
So in one sense, it seems like the headline claim is true. Most expensive Thanksgiving ever!
But we need to think deeper. A nominal price doesn’t actually tell us much. If a long-lost cousin from the Republic of Horpedahl told you it costs 1 million Jeremys to buy a Thanksgiving dinner, what would your reaction be? The first and best reaction is: how much do people earn in the Republic of Horpedahl?
We should ask the same question in the United States today: how do incomes today compare to incomes in the past? Which measure of income you use is important, but if we use median usual weekly earnings of full-time workers, we can make a simple comparison of how much of your weekly earnings would be needed to buy a traditional Thanksgiving meal. This chart shows exactly that. In 2021 that meal will be the second lowest it has ever been as a percent of median earnings — higher than last year, but tied with 2019 for the second lowest. And much less than in the late 1980s and early 1990s (I use third quarter data for each year, the most recent available).
Adjusting for income is the best way to look at this question. It’s not perfect — part of this depends on what income measure you use — but it’s much better than the alternative. The worst approach is to just look at nominal prices. This tells you virtually nothing.