“Thanksgiving 2021 could be the most expensive meal in the history of the holiday.”
That’s the first sentence of a recent New York Times story. The Times and the New York Post rarely agree on editorial matters, but on this topic the Post ran a very similar story the same week. You can find many such headlines.
But is it true? In short: no. I’ll explain why, but my larger goal is to get you to think more clearly about inflation.
How should we measure the cost of a Thanksgiving meal? A widely used measure comes from the Farm Bureau, which shows that the cost of a traditional turkey-centric meal costs about 14% more than last year. In dollar terms it is $53.31 for a turkey, a pumpkin, cranberries, sweet potatoes, stuffing, etc. That’s more that it has ever been, in dollar terms. Farm Bureau has been tracking the cost of this same meal since 1986.
So in one sense, it seems like the headline claim is true. Most expensive Thanksgiving ever!
But we need to think deeper. A nominal price doesn’t actually tell us much. If a long-lost cousin from the Republic of Horpedahl told you it costs 1 million Jeremys to buy a Thanksgiving dinner, what would your reaction be? The first and best reaction is: how much do people earn in the Republic of Horpedahl?
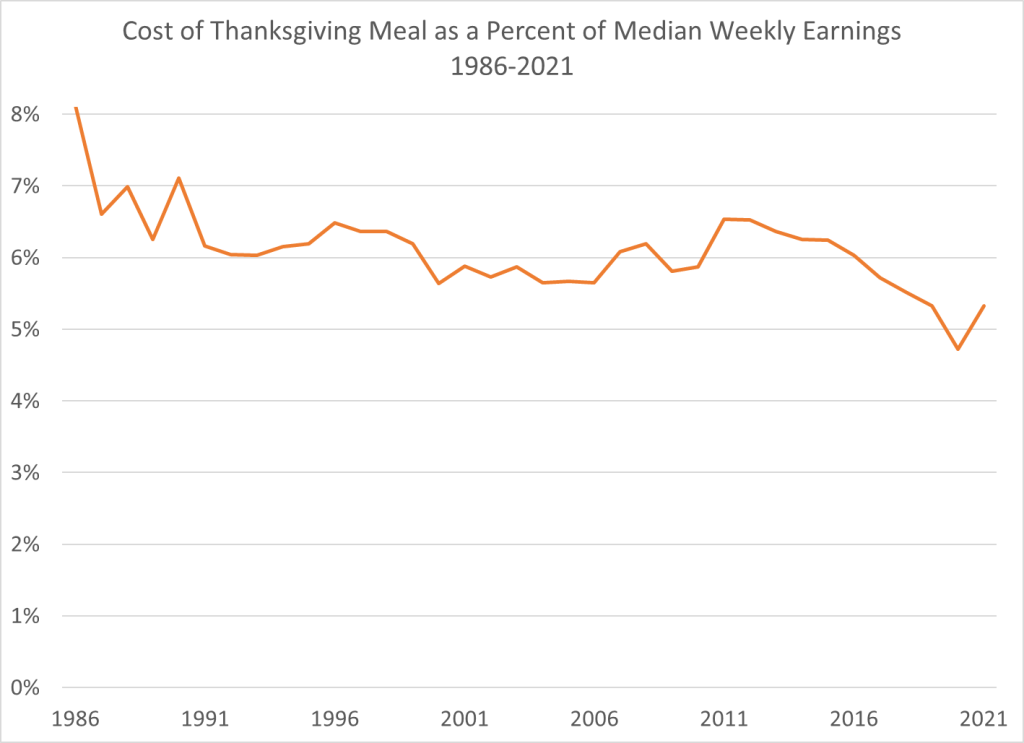
We should ask the same question in the United States today: how do incomes today compare to incomes in the past? Which measure of income you use is important, but if we use median usual weekly earnings of full-time workers, we can make a simple comparison of how much of your weekly earnings would be needed to buy a traditional Thanksgiving meal. This chart shows exactly that. In 2021 that meal will be the second lowest it has ever been as a percent of median earnings — higher than last year, but tied with 2019 for the second lowest. And much less than in the late 1980s and early 1990s (I use third quarter data for each year, the most recent available).
Adjusting for income is the best way to look at this question. It’s not perfect — part of this depends on what income measure you use — but it’s much better than the alternative. The worst approach is to just look at nominal prices. This tells you virtually nothing.
Another approach is to “adjust it for inflation.” Indeed, Farm Bureau shows this “inflation adjusted” price in a chart as well. But that’s also the wrong approach. Adjusting a particular price (or in this case, a basket of prices) for the change in the overall price level only tells you if the price of this meal has risen faster or slower than other prices. That’s interesting to know, but it doesn’t answer the more important question: is it easier or harder to purchase this meal than in the past?
Of course, adjusting the meal for wages or income is not perfect either. If other prices, say the price of housing and healthcare, have risen a lot too, it may be that your Thanksgiving meal takes up less of your income but it is still harder to purchase because the prices of other things now take up more of your income. That’s why it’s not really useful to look at any one price in isolation — whether it’s the price of a turkey, gallon of gasoline, typical family home, hot dog, or loaf of bread.
If we want to know if people are better off than in past years, we need to look at the price of all goods and services compared to their income. The following chart shows the same wage data I used in the chart above for the Thanksgiving meal, but it adjusts for all prices using the Personal Consumption Expenditures price index (for reasons I won’t get into in this post, that’s probably better than the usual CPI for inflation adjustments of this sort — perhaps a future post will go into more detail on this question).
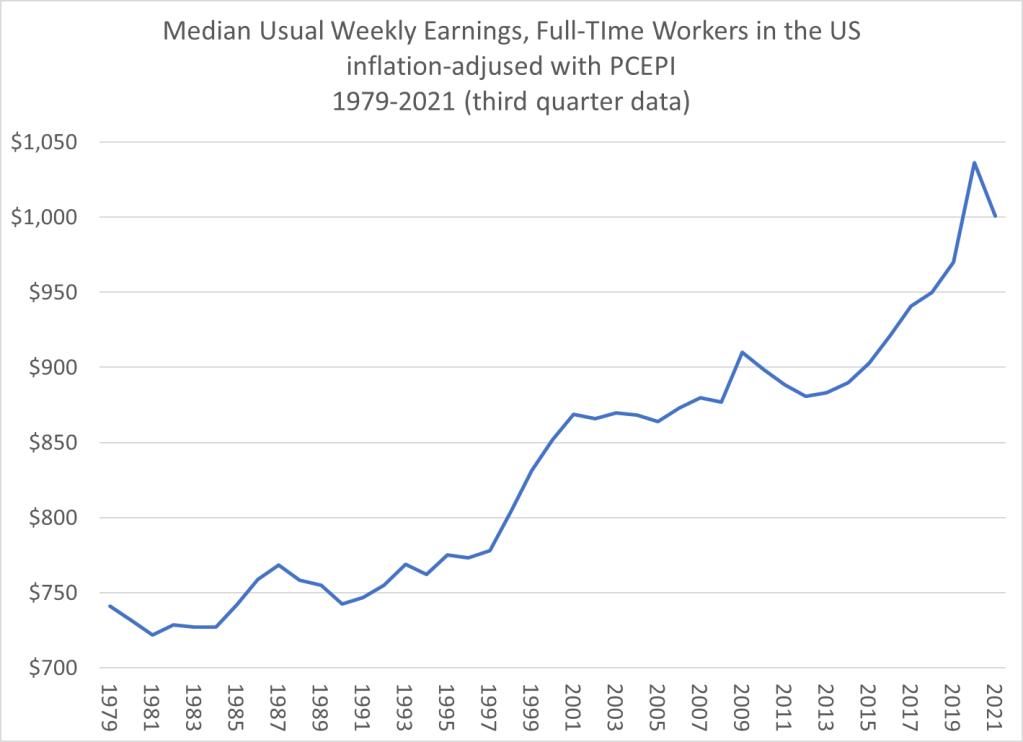
As we can see here, 2021 has the highest inflation-adjusted wages in the entire series, with the lone exception of 2020. As you probably already know, 2020 was a weird year for lots of data. 2021 is still weird, but probably less weird than 2020. For the wage data, the biggest issue is that many jobs were lost at the bottom of the pay scale in the US, so the median wage of those that still had jobs was artificially increased. We’re still not back to full employment at this point in 2021, but we’re a lot closer than last year.
Bottom line: whether we measure wages but how much turkey they can buy, or how much of all goods and services they can buy, there is no better time to be a median wage earner in the US — except for 2020, but I don’t think any of us want to relive that year. Of course, there are many different measures of income, and several ways to adjust for inflation. They don’t all give the exact same result, but in general we see the same thing: wages compared to prices are at some of the best levels in history, despite the recent price increases we have seen.
I hope you and your family have a wonderful and prosperous Thanksgiving. Keep the long run picture in perspective when you think about what to be thankful for, rather than year-to-year fluctuations.

3 thoughts on “This Is Not the Most Expensive Thanksgiving Ever”