State tax revenue is down a lot since last year. The latest comparable data from Census’s QTAX survey is for the 2nd quarter of 2023, and it shows a massive hit: state tax revenue was down 14% from the same quarter in 2022, which is about $66 billion. Almost all of that decline is from income tax revenue, specifically individual income tax revenue which is down over 30% (almost $60 billion). General sales taxes, the other workhorse of state budgets, is essentially flat over the year.
That’s a huge revenue decline! So, what’s going on? In some states, there has been an attempt to blame recent tax cuts. It’s not a bad place to start, since half of US states have reduced income taxes in the past 3 years, mostly reducing top marginal tax rates. But that can’t be the full explanation, since almost every state saw a reduction in revenue: just 3 states had individual income tax revenue increases (Louisiana, Mississippi, and New Hampshire) from 2022q2 to 2023q2, and they were among the half of states that reduced rates!
To get some perspective let’s look at long-run trends. This chart shows total state individual income tax revenue for all 50 states (sorry, DC) going back to 1993. I use a 4-quarter total, since tax receipts are seasonal (and because states sometimes move tax deadlines due to things like disasters, a specific quarter can sometimes look weird). And importantly, this data is not inflation adjusted. Don’t worry, I will do an adjustment further below in this post, but for starters let’s just look at the nominal dollars, because nominal dollars are how states receive money!
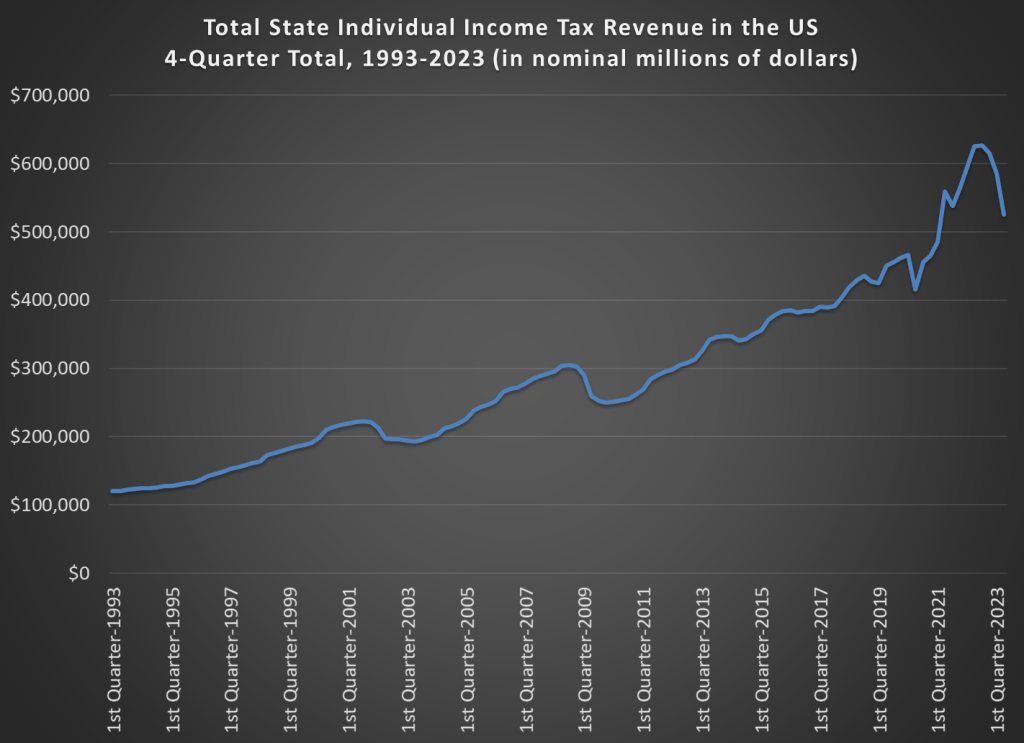
You can clearly see the drop-off starting at the end of 2022 and continuing into 2023. But also notice the massive spike in tax revenue in 2021 and 2022. You will probably recall that it was in early 2021 that price inflation really started to pick up. But it’s also the time when nominal income started to grow fast as well. Some of that was just recovery from the decline in non-transfer personal income in 2020, but some of it was faster growth as well. By mid-2022, nominal income was well above any sort of pre-pandemic trend would have projected. And nominal income is what we need to focus on here, not inflation-adjusted income, since that is the base for tax collections (even though it was, indeed, growing slower than inflation for much of 2021-2022).
OK, now it’s time for the adjustment to the above chart. But the proper adjustment isn’t an inflation adjustment. Instead, it’s best to show income tax receipts as a percent of personal income. Specifically, I will use personal income excluding government transfer receipts, both because transfer receipts are generally not taxable and because these were extremely volatile in 2020 and 2021 due to various rounds of COVID relief.
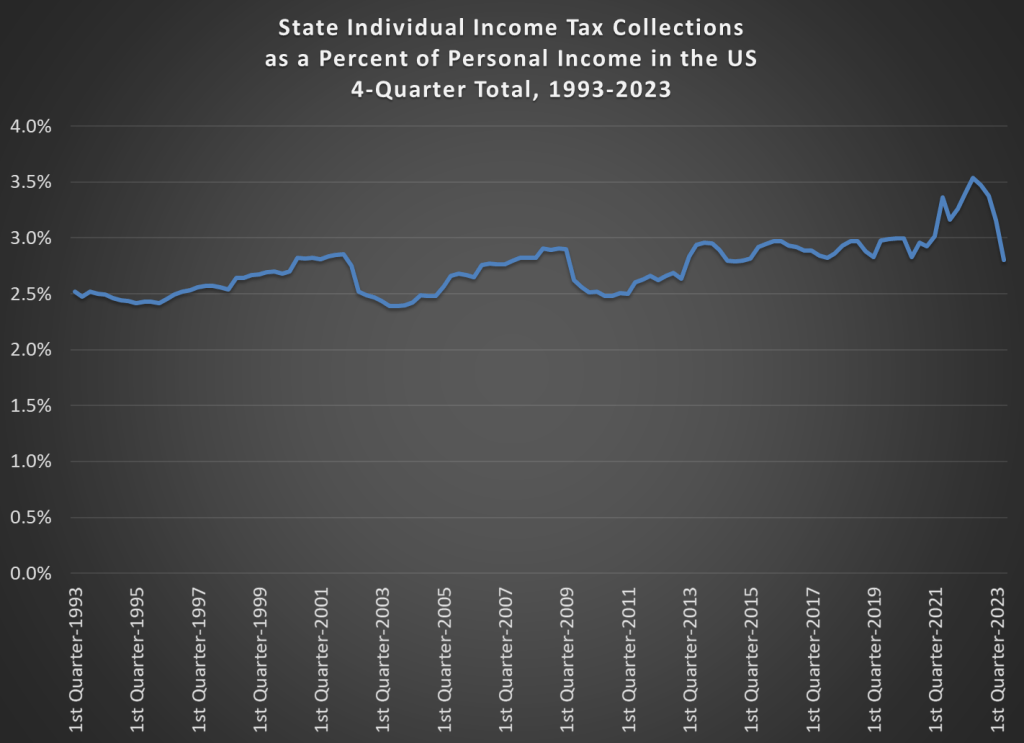
We will still see the drop in 2023, but notice now where it is dropping back to: about 2.8%. From 2013-2020, the range was about 2.8-3.0%. So we’re at the bottom of that range, but certainly well within what we would consider a normal range for individual income tax collections. And keep in mind that’s despite the fact that there has been some major income tax cuts across about half the states in the past 3 years!
I’ll ask again: So, what’s going on? Of course, a number of things. But the main thing to be explained here is why income tax revenue was elevated in 2021 and 2022. There’s nothing unusual about where we are right now: we’re back to normal. One big thing is that in 2020 and 2021 Americans received a lot of COVID stimulus of various sorts, but for much of those years they weren’t spending it, and then they decided to start spending it. While the benefits themselves were not taxable, when they spent it, that money become someone else’s income, which then is taxable.
There’s also the curious problem of how tax brackets are adjusted for inflation: there are done so after the fact. When nominal incomes go up, tax receipts will go up. But if nominal income is going up primarily due to high inflation, this ends up being a one-time shot-in-the-arm for state tax revenue. The following year, tax brackets will adjust upwards big time. But state’s get a year of higher revenue, as a treat, if you will. 2023 tax brackets in most states were adjusted up based on 2022 inflation, which meant 2023 revenue fell relative to 2022… but it doesn’t fall relative to the pre-inflation years. Exactly what we say. (Note: this cycle doesn’t occur in the dozen or so states with flat-rate income taxes, since there is no inflation adjustment to a flat rate, so it can’t be a complete explanation.)
As a final example, let’s look at one specific state: my state of Arkansas. I’ll start this chart in 2014, which is right before Arkansas embarked on a series of gradual reforms that lowered the top personal income tax rate from 7% to 4.7% in 2023 (and to 4.4% next year), as well as lowered other rates including removing some lower-income residents from the income tax completely.
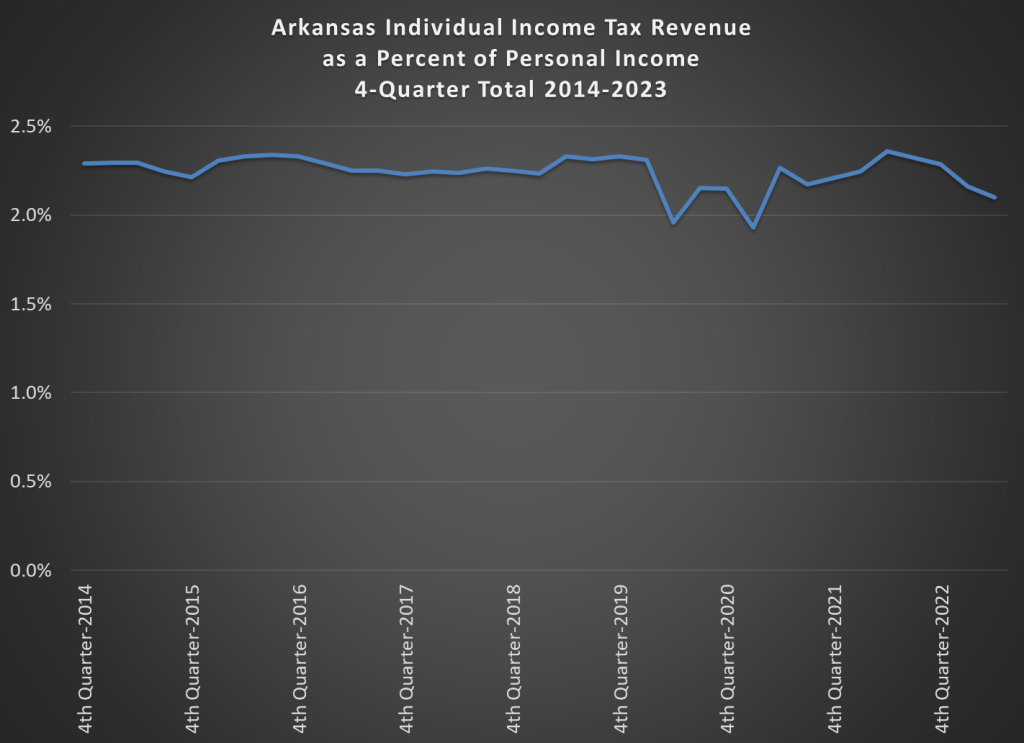
For states I just have to use the total personal income, since I can’t find a way to remove transfer receipts. So this isn’t directly comparable to the 50-state-total chart. But it’s close. One thing you will notice here is that this number is very stable over time. The most recent reading, which again is the 4-quarter total ending in 2023q2, is on the low end of the range at 2.1%. But it’s not abnormally low. However if just look at the Census QTAX data, it looks bad: individual income tax revenue is down 7% over the year (though not as bad as most states! Our temporary bump in 2021-22 was smaller). And if it had been closer to 2.3%, roughly the average for pre-pandemic years, the state would be generating about $300-400 million more in revenue per year. That’s not nothing, but it is only about 5% of the state general fund. Still, it’s a small dip given the huge reductions in income tax rates here.
Now, whether states have managed this boom-and-return-to-normal tax cycle over the past 3 years is another question. Some have, but some haven’t. Some have cut taxes. Some have increased reserves. Others have committed to new spending programs. Each states’ future fiscal path will in many ways be influenced with how they managed their finances during this strange period for public finance.

In interesting artcile – makes you realize there’s a lot more than “meets the eye” when financial reports are provided, and also that you can likely make data say what you want it to say depending on which data you use to make your point. I live in Illinois and it seems no matter what, the state does not get enough income (or just keeps spending much more than it takes in.)
LikeLike