The year 2023 was a pretty good one for the economy, whether judged by the labor market or economic growth. Despite this good economic growth, total receipts of the federal government were down about 7 percent from 2022 (note: I’m using calendar years, rather than fiscal years). Here’s a chart (note: in NOMINAL dollars) of total federal revenue since 2009:

I want to stress that these are nominal dollars (there, I’ve said it three times, hopefully there is no confusion). Nominal dollars are usually not the best way to look at historical data, but for purposes of looking at recent government budgets, sometimes it is. Especially when revenue is declining: if I adjusted this for inflation, the decline in 2023 would be even larger!
You’ll notice also that the decline in 2023 is even larger than the decline in 2020, the height of the pandemic when many people were out of work due to government regulations and changes in consumer behavior. The 2023 decline is big!
So, what the heck in going on with federal revenue in 2023?
Breaking revenue down into categories gives us a better idea. In nominal terms, total revenue was about $350 billion lower in 2023 than in 2022 (calendar years, using data from the US Treasury). The biggest culprit is Individual Income Taxes, which declined by $400 billion, accounting for all of the net decline. Some other categories declined too, while other increased, such as social insurance and retirement receipts which increased by $130 billion. That’s a big increase! But it was offset not only by the individual income tax receipts, but also deposits of earnings by the Fed ($80 billion), Customes Duties ($20 billion), and a few others. But on net, individual income taxes are the big one to watch.
This seems like something of a mystery. How can individual income tax receipts be falling in a year when not only is the economy growing, but personal income (the base for the income tax) rose by over 5 percent in nominal terms?
When Treasury Secretary Janet Yellen took up this question in October 2023, she also zoomed in on the drop in individual income tax receipts, and further she claimed “The decrease in receipts for FY 2023 compared to FY 2022 can be attributed to $456 billion lower individual income tax receipts as capital gains realizations fell.” Capital gains! That could be the culprit (note: she is using fiscal years rather than calendar years as I am, so the numbers are not exactly the same). She also mentions the decrease in deposit earnings by the Fed, but in her calculation this is also much smaller than income taxes.
So, is that it, capital gains realizations and taxes fell? In much of the publicly available data, we don’t get income taxes broken down into wages and salaries versus capital gains and other smaller categories. And I have no doubt that the Treasury Secretary has access to better data than I do, but I’m skeptical that capital gains taxes could be causing most of the movement in income tax receipts (remember, a decline of $400 billion).
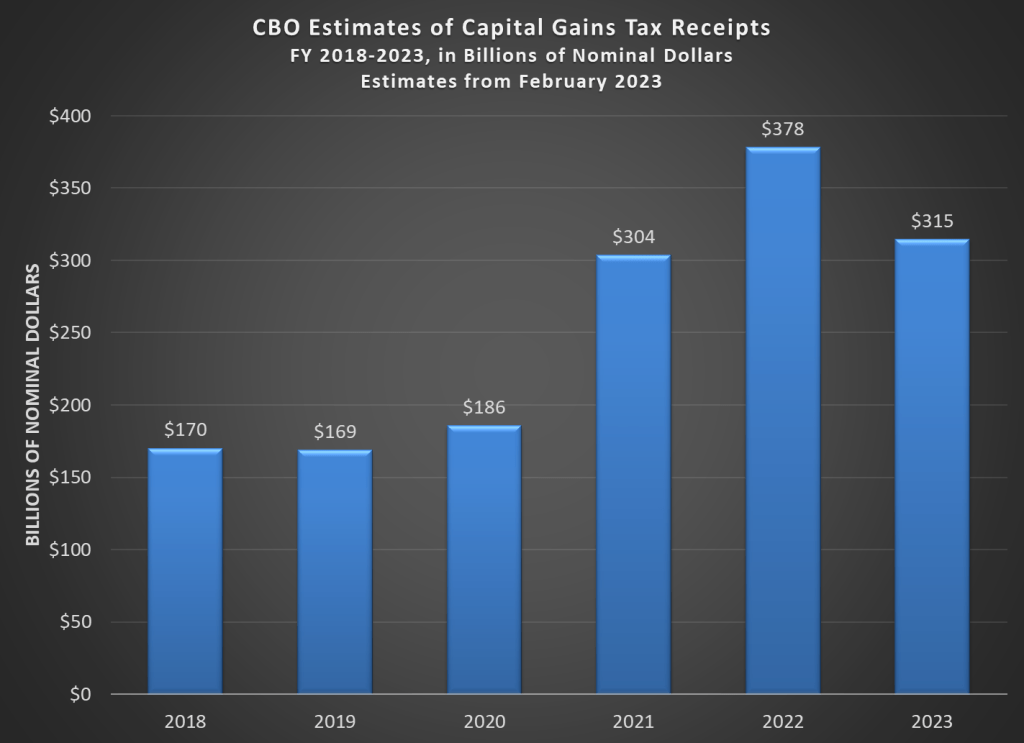
The Congressional Budget Office regularly produces estimates of how much revenue comes from subcategories of the income tax such as capital gains taxes. In their estimate from February 2023 (most recent I could find), there are only $378 billion in capital gains tax receipts in total in FY 2022 (see Table 6). Unless capital gains tax collections are going to zero, this can’t account for a $400 billion decline! The FY 2021 and 2022 figures were quite large, more than double prior years! But CBO estimates that in FY 2023 there would still be $315 billion in CG tax receipts, or a decrease of only about $60 billion. Perhaps that estimate was way off, but even if CG tax receipts only went down back to pre-pandemic levels, this can account for at most half of the decline.
What have we learned so far? Individual income tax receipts are the big driver of declining revenue. Within income tax receipts, capital gains tax receipts probably accounted for a big part of the decline, but not all of it. Looking into the same CBO file linked above, this time at Table 3, it doesn’t seem that any other major categories jumps out as being a big driver of the change: wages/salaries, interest, and dividends all likely increased from 2022 to 2023. Of course, these are modeled estimates, not actual data, so something could be dropping, but some of the decline has to come from the biggest category within income taxes, which is salaries and wages.
How could receipts from salaries and wages be falling even though income is rising? There were no major changes to the tax code in 2023 that would have caused this. Except for one: inflation adjustments. As is well known, tax brackets are adjusted for inflation each year to prevent “bracket creep” whereby people are pushed up into higher tax brackets as their nominal income increases. Following the high inflation of the 1970s, the federal government and most states inflation-indexed their tax brackets. So how could this still be causing a drop in income?
Here’s the key: inflation adjustments are done after the fact. When we had high inflation, as well as big nominal increases in income, in 2022 some taxpayers were pushed up into higher tax brackets. In 2023, tax brackets and other features of tax code (such as the standard deduction) were inflation adjusted based on inflation rates from September 2021 to August 2022 (here’s a good explainer on the history of inflation adjustments to the tax code). The adjustment used in 2023 was 7.1 percent, which is a huge adjustment for the tax code, but the key is it didn’t apply to 2022, it only applied to 2023. Inflation adjustments, for a variety of reasons, aren’t done in “real time,” so there will always be at least one year of bracket creep. How much of the total is due to bracket creep is hard to quantify, but I suspect it is fairly large.
I’ve discussed this issue before in the context of state tax receipts declining in 2023, and I’ll follow up on that post again soon. But for now, I’ll leave you with a chart showing the pattern of tax revenue for states that don’t have an income tax.
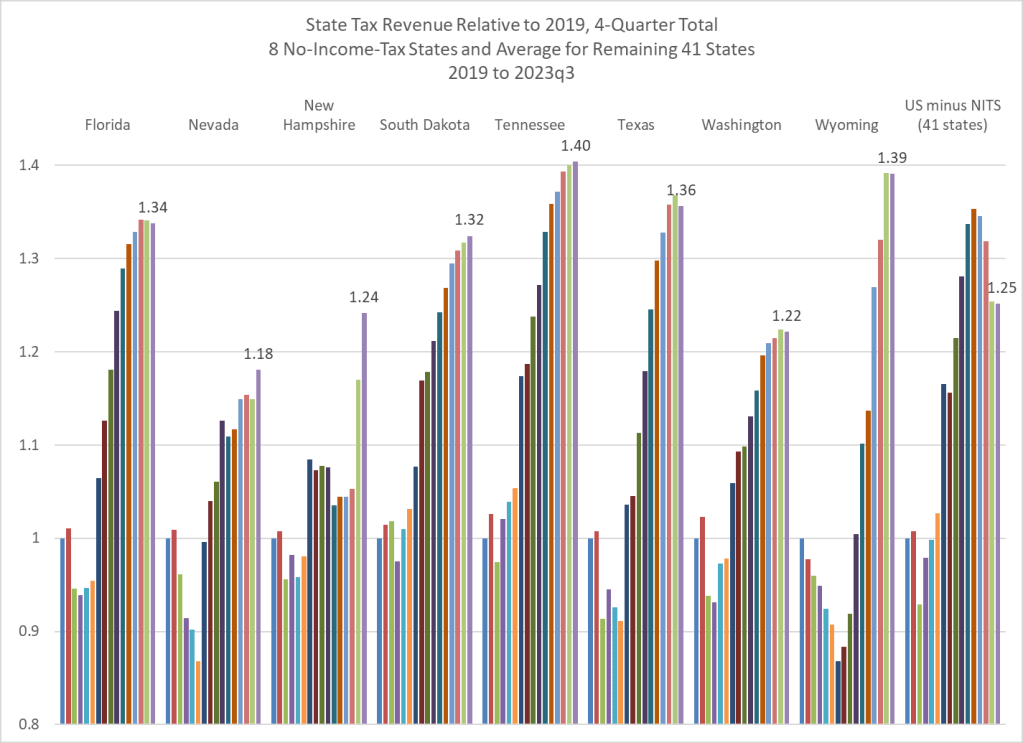
The first bar for each state is 2019, and the final bar is the 4 quarters ending in 2023q3 (the data comes from Census’s QTAX). I’ve left out Alaska, because revenue is so volatile that it makes the chart unreadable: Alaska’s revenue had been as much as 266% of the 2019 baseline, but now is “only” 155 percent in the most recent 4 quarters. But if you look first to the far right of the chart, you’ll see the familiar pattern of tax revenue spiking in 2021 and 2022 as inflation ramps up, and then falling back significantly in 2023.
But notice for the no-income-tax states shown here, that pattern doesn’t really happen. The most recent four quarters of tax collections are essentially the highest (in nominal dollars) that they have even been (with some small exceptions). Income tax revenue is always volatile compared to other sources, but it’s especially volatile in a time of high inflation!

The culprit could be capital gains. Cap gains are reported on tax returns, so the 2023 tax return collections are reflective of the 2022 calendar year. What happened in 2022? Both the stock market and bond market tanked.
It’s possible that not only did cap gain collection fall to zero, it’s possible that they actually resulted in negative collections (more capital losses than gains) resulting in further reductions to people’s net tax bill.
LikeLike
I discuss capital gains at length in this post. There’s even a chart!
LikeLike