Every month we get new data on the labor market in the US from the Bureau of Labor Statistics. As I pointed out last month, the labor market data from 2023 was very good!
But lately on social media, some have been to ask whether this data is credible. Specifically, several people have pointed out that the initial numbers we receive each month almost always seem to be revised downward. Since the initial reports are based on incomplete data (for the jobs data, this would be reports from employers), it is normal that there would be some revisions with more complete data.
But for 9 of the first 10 months in 2023, the revisions were downward (and even July was first revised down, only to be revised up later). And November has already been revised down once. This pattern seems a bit suspicious, as we would normally expect these errors to be somewhat random, and indeed the last time the revisions have mostly been downward was in 2008 (which was a very different year, since it was a year of job losses, not gains as in 2023).
So what’s going on?
First off, I need to tell you that the data will be revised again. BLS performs an annual “benchmarking” process to the nonfarm payroll jobs data once they have the complete universe of data available (or at least, the universe of workers covered by unemployment insurance, which is about 95% of workers). That universe is known as the Quarterly Census of Employment and Wages, or those that have been around long enough it’s sometimes referred to as “the 202” (after the ES-202 program, the original name of the QCEW). This benchmarking was last done in February 2023, and in this case 9 of the 12 months were revised upwards for 2022.
The QCEW is available now through the 2nd quarter of 2023. That’s 6 months behind the monthly reports we get, but it might be useful to look at this data to see how well the labor market is really doing.
This data is not seasonally adjusted (another reason the monthly jobs reports are sometimes revised). It is just the raw counts of people employed. So, month-to-month comparisons don’t make sense, and it’s best to look year-over-year. And since June is the latest month available, I’ll use that month in most of the charts for this post.

Looking at the year-over-year change through June for the past 22 years (the start of the QCEW series with the implementation of the NAICS industry codes), recession years like 2009 and 2020 definitely stand out. And more recently, 2021 and 2022 stand out as many of the 2020 job losses are quickly recovered. But by the time we get to 2023, most of the job gains are not merely post-COVID recovery. The unemployment rate was back down to 4% for most of 2022, so these can be considered real job gains.
Notice that the 2.4% increase from June 2022 to June 2023 is the best year in this data series, other than post-COVID quick recovery years.
But maybe some of the tail-end of 2022 was still post-COVID recovery. What if we just look at the job gains in 2023 so far, and compare it to similar periods in the past? Because of seasonal fluctuations, this can be a little dangerous, but we’ll proceed with caution. The following chart shows the percent change from January to June of the same year.
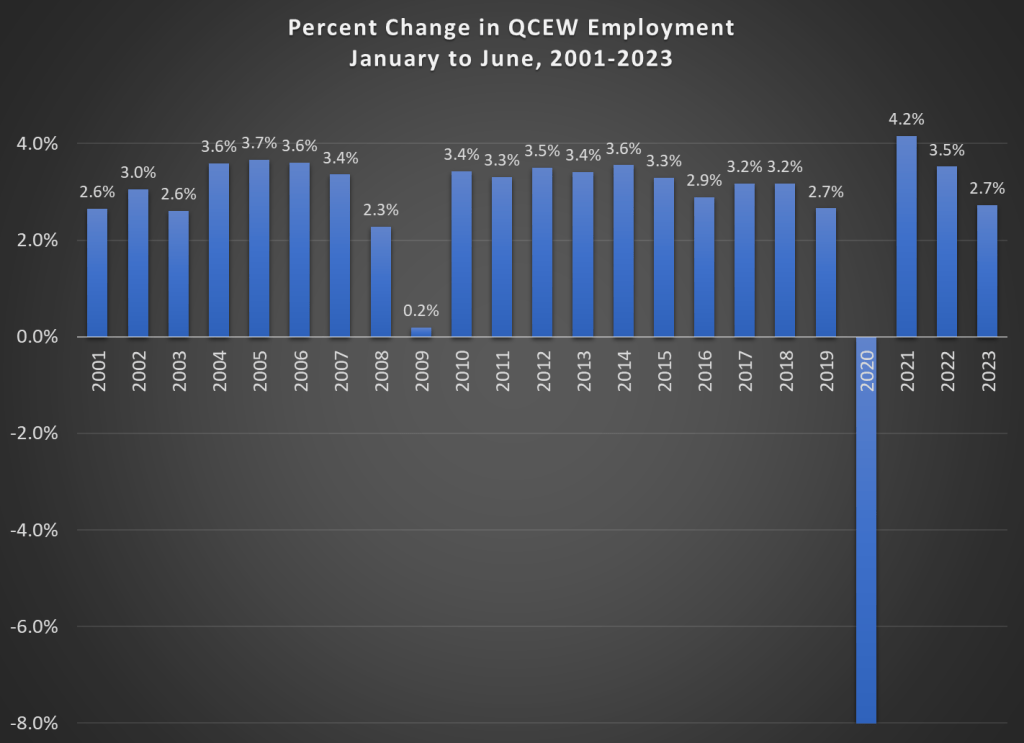
Notice here that there is almost always an increase in jobs from January to June. This is a normal season pattern. Once again 2020 is the outlier and messes up all of our graphs! But take a look at 2023. The 2.7% growth of jobs is, perhaps, slightly below average for the past 2 decades, but it’s not that far out of line. It’s exactly equal to 2019, another year where unemployment was at or below 4% for the entire year. Full employment, as they say. From this perspective of job growth, 2023 seems like a pretty normal year.
But what about when we have complete 2023 QCEW data? Are we in for some massive downward revisions to the payroll jobs data?
Probably not. Using the available QCEW data, we can compare with the not-seasonally-adjusted payroll jobs data. Here’s what we find:
June 2022 to June 2023 growth
- Nonfarm jobs: 2.4%
- QCEW jobs: 2.4%
January 2023 to June 2023 growth
- Nonfarm jobs: 2.7%
- QCEW jobs: 2.7%
You’ll notice that these sets of numbers are… exactly equal. The total change in jobs as reported in the monthly reports for 2023 so far (as revised) are exactly in line with the universe of jobs data (the QCEW). There’s no guarantee, of course, that the second half of 2023 will be these dead-on, but I don’t see anything to suggest otherwise.
So, in conclusion, the jobs numbers probably aren’t fake. The constant downward revisions in 2023 are interesting, and perhaps a little troubling that we’re not getting super-precise data in real time. But those numbers are always known to be early estimates. And based on complete data, they actually look pretty decent (almost right on, in fact). As always, we’ll keep watching the numbers.
As a final thought, I’ve also seen some commentators worrying about or doubting the job growth numbers because of large increases in government employment. And while it is true that government employment has been rising lately, as a share of the workforce it is still below pre-pandemic levels. But we can also use the QCEW employment numbers to look at this question, by focusing only on private-sector workers. Here’s the first chart from above, but only for the private sector

Job growth through mid-2023 still stands out as one of the strongest years in the past 2 decades.

But the question still stands, what caused the consistent downward revisions in 2023 (and the reverse in 2022)? Paranoid minds want to know!
LikeLike
clowns didn’t understand the impact of phoney numbers then had to release the real numbers.
please let us know the last time this occurred with such large numbers?
LikeLike