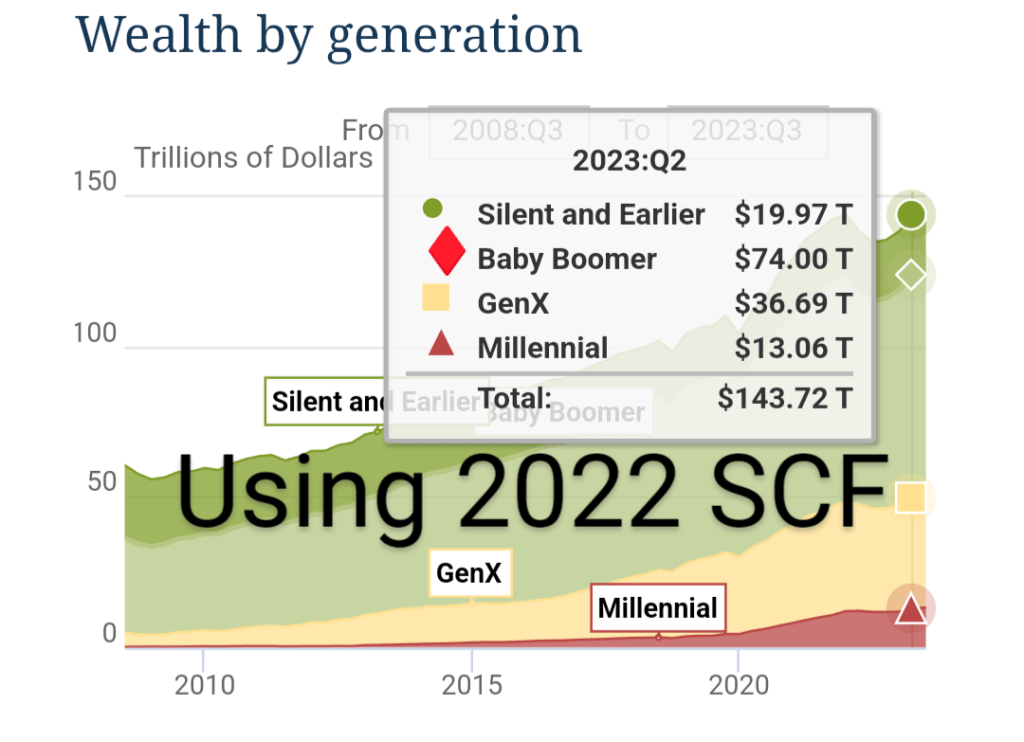
I’ve written numerous times about generational wealth on this blog. My biggest post was one comparing different generations using the Fed’s Distributional Financial Accounts back in September 2021. I’ve posted several updates to that post as new the quarterly data was released, but this post contains a major update. I’ll explain in great detail below about the updates, but first let me present the latest version of the chart (through 2023q3):

Regular readers will notice a few differences compared with past charts. The big one is that young people have a lot more wealth than it appeared in past versions of this chart! You’ll also notice that I have relabeled this line “Millennials & Gen Z (18+)” and shifted that line over to the left a few years to account for the fact that this isn’t just the wealth of Millennials, and therefore the median age of this group is lower than in my past charts. The two dollar figures I highlighted are at the median age of 30 for these age cohorts (unfortunately we don’t have data for Boomers at that age).
Updated Survey of Consumer Finances
The data I have always used in this chart comes from the Fed’s DFA which is updated quarterly. But that data is based on another Fed survey called the Survey of Consumer Finances, which is a large survey done every 3 years. The DFA data just projects the SCF data forward based on some assumptions. It turns out that when the 2022 survey data was released (read my summary of the data), young people had a lot more wealth than we thought based on just projecting the 2019 data forward.
Here’s one way to show the change. When we look at the wealth data for 2023q2 prior to the inclusion of the 2022 SCF, Millennials looked like they had about $8.3 trillion. But with the 2022 update, they now have over $13 trillion. There’s also a small overall decrease in wealth (again, looking at the same quarter but before and after the update), mostly correcting Gen X but a little for Boomers too.

If I had merely updated my charts using this new data, Millennials would be looking very good indeed in 2023q3: average wealth at the median age of 35 would be $183,000, compared with just $134,000 for Gen X and $107,000 for Boomers (yes, all adjusted for inflation, in this case with the PCEPI). But that big jump got me thinking about how the Fed DFA defines “Millennials”…
Including Gen Z
The Fed DFA defines Millennials as anyone “born 1981 or later.” For most years of this survey, that’s perfectly fine, as Gen Z were still children. But in 2023, the oldest members of Gen Z are 26. They are becoming adults and acquiring wealth. In 2022, 30 percent of 25 year-olds owned a home! This means that in the Fed DFA data, they are actually mixing in some of Gen Z’s wealth with Millennials. And when I just used the total Millennial population as the denominator, I would get the $183,000 wealth figure mentioned above, approaching double what Boomers had at the same age!
So how to fix this? The Fed’s SCF does have microdata, but that’s a lot of work and anyway it would quickly be out of date since wealth in 2023 is already much larger than 2022 thanks to the stock market increases recently.
Here’s how I settled on a fix, which is reflected in the first chart of this post: I used a new denominator that included all Millennials plus the population of Gen Z that is 18 or older. This will still bias the numbers down somewhat, since it is no longer an apples-to-apples comparison with earlier generations (I’m now using a large group that ranges from 18 to 42 years old in 2023, 18 to 41 in 2022, etc.). But I think it’s a reasonable way of working with the data that we have, until the Fed DFA updates with a separate number for Gen Z and Millennials.
This also means that I need to shift the Millennial/Gen Z line to the left to account for the lower median age of this group, which is now 30 in 2023 rather than 35. Doing so makes them look substantially wealthier than Gen X at the same age: well more than double! It also doesn’t make much of a difference here if I used the CPI instead of PCE (Gen X would have $52,000 instead of the $56,000 in my chart).
No comparison is perfect, but I think these are the best we can do with the current data.
To make sure I’m not completely out to lunch with my comparisons, we can use the Fed SCF data for 2022 to look at the wealth of young people. They don’t have it by generation in the publicly available data, but we can look at age cohorts which roughly approximate the generations. Ages 35-44 is mostly older Millennials, which “Under 35” will be a combination of Millennials and Gen Z. The average net worth of both these groups is the highest it has ever been (the median is too, but average is comparable with my chart). For reference, the 35-44 age group is mostly Boomers in 1989 and mostly Gen X in 2007.


Are these comparisons inflation adjusted or not? If not, I do not think this is a particularly great chart to examine.
If my math is correct, Gen X would have been 30 around 2002? Inflation since then has been about 65-70% which closes the majority of the gap. At least some of it should also be explained by the fact that 2002 was right in the middle of the 2001 market crash while right now we are at market High (I am guessing that is why we see a sharp decline in Gen X wealth right around 30.
LikeLike
Yes, it’s adjusted for inflation.
LikeLike
An interesting conversation is going on at https://www.reddit.com/r/Millennials/comments/19exybs/millennials_now_have_a_lot_more_wealth_than_genx/
LikeLike
All the usual suspects of complainers! Is it adjusted for inflation? What about median? Why a log scale? How much is real estate? How much is stocks?
LikeLike
Where on the FDA website does it state is is adjust for inflation? The links, charts, and data table links for the FDA website you provided do not state “adjusted for inflation” or any such financial language indicated an adjustment.
LikeLike
It says so right at the top of the chart!
LikeLike
It is hard for people to believe this article when the first graph you display shows the same spacing between 4k and 40k as 40k and 400k.
LikeLike
Log scales are very common for looking at long run growth rates. But I have shared the graph before on a linear scale and still get … well basically the same comments.
LikeLike
“It says so right at the top of the chart!” You are right. It does show that on your chart. It does not show that on the chart from the fda website you provided.
https://www.federalreserve.gov/releases/z1/dataviz/dfa/distribute/chart/
Seems awfully deceptive.
LikeLiked by 1 person
I adjusted that data for inflation.
Here’s what it looks like if you don’t adjust for inflation: https://twitter.com/jmhorp/status/1750537030097101155?t=R1-WSz7Ite8tXAax2WCLWA&s=19
LikeLike
Jeremy’s chart has become an entire Newsweek article https://www.newsweek.com/millennials-gen-z-wealthier-previous-generation-same-stage-1863904
LikeLiked by 1 person
It would be much more interesting if you did this analysis and stripped out real estate holdings, which are accounting for the vast majority of increases between 2019-2024, and are skewing the data disproportionally toward those who have turned 30 in that range (born Oct 1989 – Dec 1993). Using the chart you linked to, as a matter of %, Gen X held 5.72% of U.S. wealth in Q1 2002, when their mean age was 30, and Millennials held 3.56% of U.S. wealth in Q1 2019, when the mean age of a true Millennial (born 1981-1996) was 30 (and the oldest Gen Z kid was only 21).
LikeLike
Here’s a chart without real estate: https://twitter.com/jmhorp/status/1750534741621907870?t=495enqr65fhFMSUwypChhA&s=19
LikeLike
It’s obvious that you’re getting a lot of engagement on this post, and the accompanying Newsweek article, so I wanted to just ask you straight out: Why, in your analysis, are your findings completely non-reflective of the median (or majority of) Millennial/Gen-Z American(s)?
LikeLike
I’m not sure what you mean by “non-reflective”
LikeLike
Your method of analysis concludes that the average Millennial/GenZ American has a net net worth of ~$118k at age 30. Removing Real Estate, that figure drops to an average of ~$86k, as noted on your supplementary chart. This would imply that a.) Real Estate is only accounting for ~$32k of the average Millennial/GenZ American’s net worth at the median age of 30, and b.) that the $86,000 is held in a mix of cash and securities. According to other reporting (https://www.cnbc.com/2023/10/28/americans-median-net-worth-by-age.html) the median net worth for Americans under 35y.o. (let alone a median age of 30) is less than half of that $86,000 figure–and that *includes* real estate–and is approximately one-third of the $118k sum. Ergo, your “average wealth” figure does not seem to be remotely correlated to the actual median American Millennial/GenZ circumstance, and instead seems incredibly skewed by the disproportionate allocation of wealth among the Millennial billionaire class. This, coupled with the generational “% of all American wealth” figures that I mentioned in my first comment suggest findings that are not consistent with the tone of your writing.
LikeLike
Median wealth for those under 35 in 2022 is by far the highest it has ever been in this survey, nearly double any recent past year (yes, it’s adjusted for inflation): https://www.federalreserve.gov/econres/scf/dataviz/scf/chart/#series:Net_Worth;demographic:agecl;population:1;units:median;range:1989,2022
LikeLike
I understand that, but that’s not what I asked. If median wealth is ~$39k including real estate, and your graphs show that *average* wealth is $118k including real estate (3.025x the median), than your report isn’t really reflecting the experience of a majority of the Millennial & Gen Z generations, but is instead disproportionally representative of the upper end of the data set. I know you know this. What I’m asking is, why present it that way? I want to presume that you’re writing in good faith.
LikeLike
Is there a reason why you never show median data? One wonders.
LikeLike
Median wealth in this data source is only current through 2022, so I use averages much more frequently for real-time data, but here is one post using median wealth: https://economistwritingeveryday.com/2025/06/18/household-formation-and-generational-wealth/
LikeLike
Can you display this same chart with median wealth? Ie, to account for the possibility of higher inequality among Millennials
LikeLiked by 1 person
Not the exact same chart, but read the last paragraph of the post and click the link to see a median wealth chart by age
LikeLike
He’s not honestly interested in investigating inequality within one generation, let alone between two generations, that’s why he’s merged together Gen Z and Millenials, made adjustments, ignored microdata to come up with Frankenstein-like statistics that don’t pass the sniff test.
LikeLiked by 1 person
I didn’t merge the generations, that’s how they are in the DFA. I explain this in the post!
LikeLiked by 1 person