Economics as a discipline really likes to boil things down to their essentials. There are plenty of examples. How many goods can one consume? Just two, bread and not bread. How can you spend your time? You can labor or leisure. How do you spend your money? Consume or save. It’s this last one that I want to emphasize here.
First, all income ultimately ends up being spent on consumption. Saving today is just the decision to consume in the future. And if not by you, then by your heirs. One determinant of inter-temporal consumption decisions is the real rate of return. That is, how many apples can you eat in the future by forgoing an apple eaten today? The bigger that number is, the more attractive the decision to save.
Further, since most saving is not in the form of cash and is instead invested in productive assets, we can also characterize the intertemporal consumption problem as the current budget allocation decision to consume or invest. The more attractive capital becomes, the more one is willing to invest rather than consume. The relative attractiveness between consumption and investment informs the consumption decision.
How attractive is investment? I’ll illustrate in two graphs. First, if the price of investment goods falls relative to consumption goods, then individuals will invest more. The graph below charts the price ratio of investment goods to consumption goods. Relative to consumption, the price of investment has fallen since 1980. Saving for the future has never been cheaper!

Of course, as in a price taker story, I am assuming that individuals don’t affect this price ratio. Truly, prices are endogenous to consumption/investment decisions. For all we know, it may be that the prices of investment goods are falling because demand for investment goods has fallen. But that doesn’t appear to be the case.
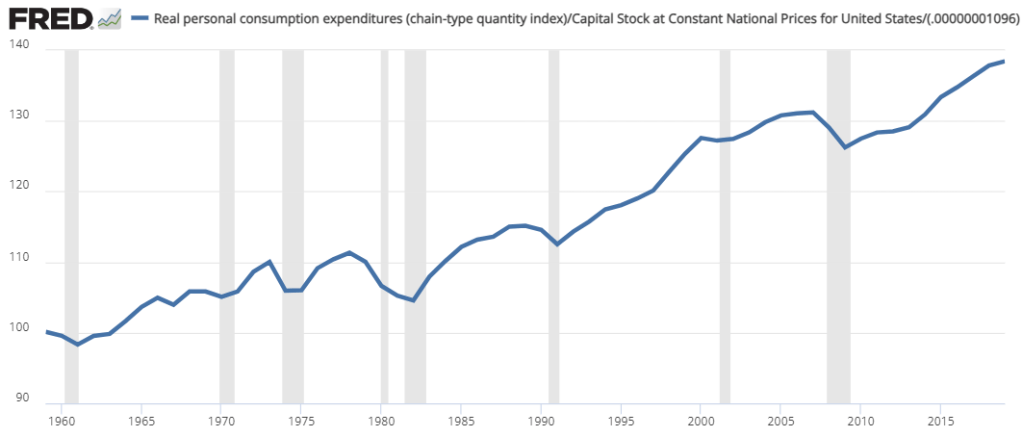
Another feature that affects the investment-consumption tradeoff is the productivity of capital. As capital becomes more productive, it also becomes more rewarding in terms of future consumption. How much consumption do we get per unit of value tied up in capital? That brings us to the second graph: Consumption per unit of capital stock.* The total amount of inflation-adjusted consumption per unit of capital has been rising for the past 60 years. Over this time period, investing in future consumption via capital has been a great deal.
This all seems like good news! But it also prompts us with a mystery. How is it that capital has been becoming increasingly productive and also increasingly affordable? Shouldn’t capital become more valuable as it can produce more consumption?
My preferred theory is that capital doesn’t just produce consumption. It also produces more capital! Capital producing more consumption results in more consumption per unit of capital. Capital producing more capital results in lower price of capital. In other words, we are living through an age of productivity growth! Look around and see the splendor of your investment – and consequent consumption!
How about them apples?
Interest rates are glaringly absent in my story above. But discriminating readers will also note that interest rates determine the present value of capital – the price.

One thought on “Future Consumption Has Never Been Cheaper”