A new essay by J. Zachary Mazlish answers the title question in the affirmative: yes, inflation made the median voter poorer. The post is data-heavy, with lots of charts and different ways of slicing the data, which is great! But since I am called out by name (or rather, my evil twin, Jeremy Horpendahl), I want to respond specifically to the claim about my data, but also I’ll make a few broader points.
Here’s the Tweet of mine that he links to:
https://twitter.com/jmhorp/status/1854548669317455894
Regular readers will recognize the chart in that Tweet comes from an EWED post from April 2024. Mazlich says that my chart and others like it are “misleading for understanding the election because a) they compare wages now versus January 2020, rather than January 2021.”
Fair enough, but if you read my Tweet you will see that I am specifically responding to an NPR story which said, “if you look at the difference between what… groceries cost in 2019 and what it costs today, and what wages looked like in 2019 and today, the gap is really gigantic.” So, they are specifically using 2019 as a baseline in that story, and my chart specifically used that as the baseline too! That’s why I thought that chart was relevant.
It’s true, of course, that if you want to understand median voter sentiment about the Biden administration, you should probably start the data at the beginning of the Biden administration. But I was responding to the more general claim people make, that they are worse off than in 2019.
With that clarification out of the way, what does Mazlich’s broader post say?
Again, his post is very detailed and makes many points, so please read it in full. But here’s my short version: if you look at post-tax-and-transfer annual income rather than hourly income, the median voter is worse off. And furthermore, it looks even worse if you look at household income. The hourly measures all show positive growth under Biden for the median worker (though less than under recent administrations).
His results are summarized nicely in this figure:
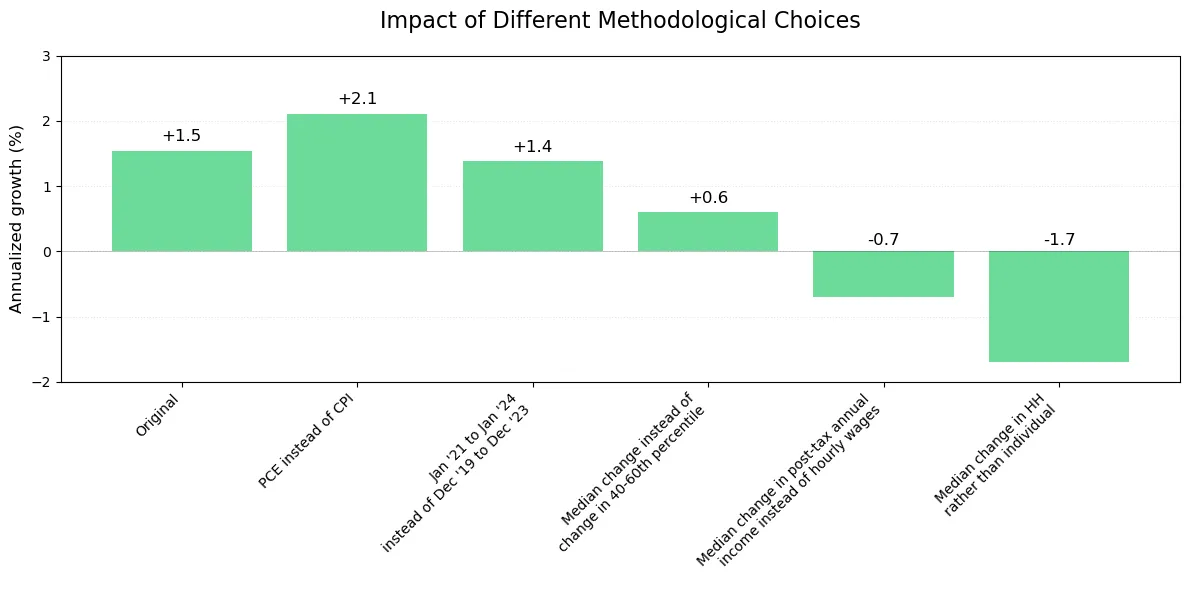
The changes he makes are certainly sound. And his caveat is also correct: “Much of this decline is due to timing of pandemic stimulus and even less the ‘fault of Biden’ than other things.” He doesn’t go into detail on pandemic stimulus, but recall that there were two economic impact payments in 2020 (though many probably got the 2nd payment in 2021), one economic impact payment in 2021, and an expansion of the Child Tax Credit in 2021. So using total money income, you will see a big bump in 2020 and 2021, making these problematic as a baseline for assessing market income, but it does truly represent the money in people’s pocket (you see a similar effect with total real personal income in the US for 2020-21).
But while I think his changes are sound, the challenge with performing this analysis right now is that we only have CPS ASEC data through 2023. He mentions this briefly in the post, that the March 2024 ASEC only covers calendar year 2023. So not only are we missing one of Biden’s four years, based on various other measures of wages and income, we are probably missing the best year! Of course, you work with the data that you have (I said the same thing in a September post about the ASEC data), so this is no fault of Mazlich’s. But voters certainly have experienced most of 2024 already!
Unless I am missing something, the last two bars in the chart from Mazlich above show calendar year 2023 income compared with calendar year 2020. But we want 2024 income! And using average hourly wage data, we see that so far in 2024 (through October), wages have grown 3.3% compared with 2.2% CPI inflation. One-percent real wage growth may not sound like much, but it’s better than the prior 3 years under Biden for the same timeframe (the first two years had negative real wage growth with this measure!).
If we use the standard real median household income data (without making the adjustments Mazlich does), we see that 2023 income was slightly higher than 2020, but still below 2019. Will 2024 be above 2019? We can’t say for sure, but it will almost certainly be higher than 2020 through 2023. I suspect growth will still be weak by these annual post-tax-and-transfer measures under Biden, but I doubt that the median household will be worse off (unless your baseline is a particular trendline, to which I suggest you glance around the world).
One last thing about a chart from his post. Several people have asked me about this one:
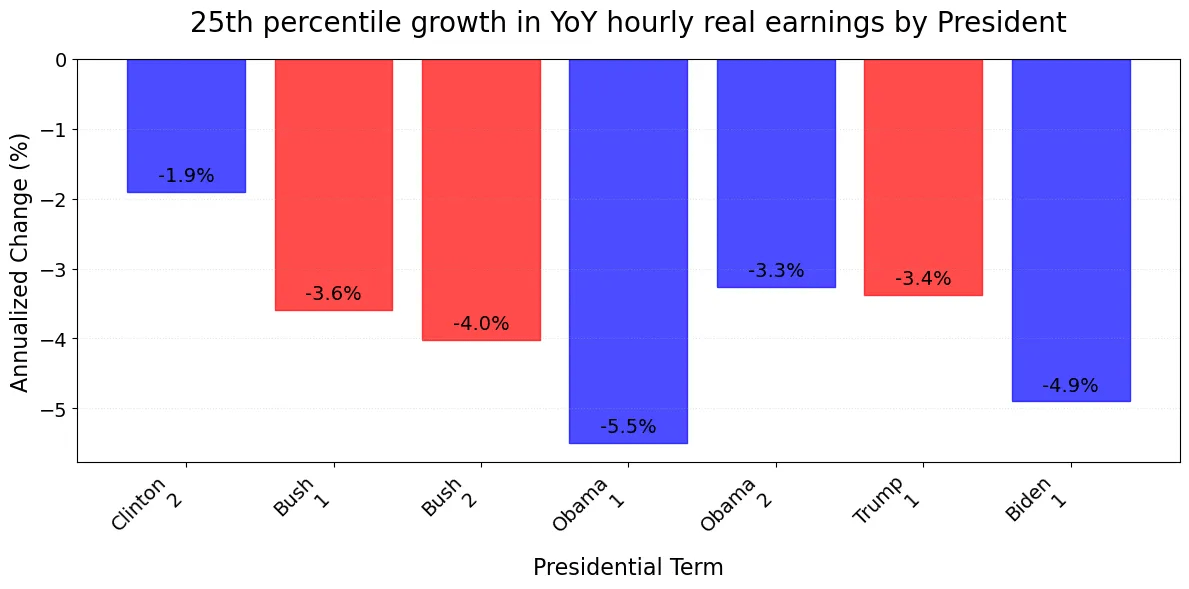
This looks shocking. Have real wages at the 25th percentile really been falling for almost 30 years? No. This chart shows the 25th percentile change in wages, not the change in 25th percentile wages. What’s the difference? This chart suggests that each year 25% of workers (or more) are getting a real pay cut. It does not say the worker at the 25th percentile is worse off. And it’s not just inflation-adjusted wages. Even if you use nominal wages, this measure is negative. See this chart from the Atlanta Fed (the source of the data), which goes back to late 2019: every month is either negative or zero! In fact, you can download the data back to March 1997, and every single month is either negative or zero.
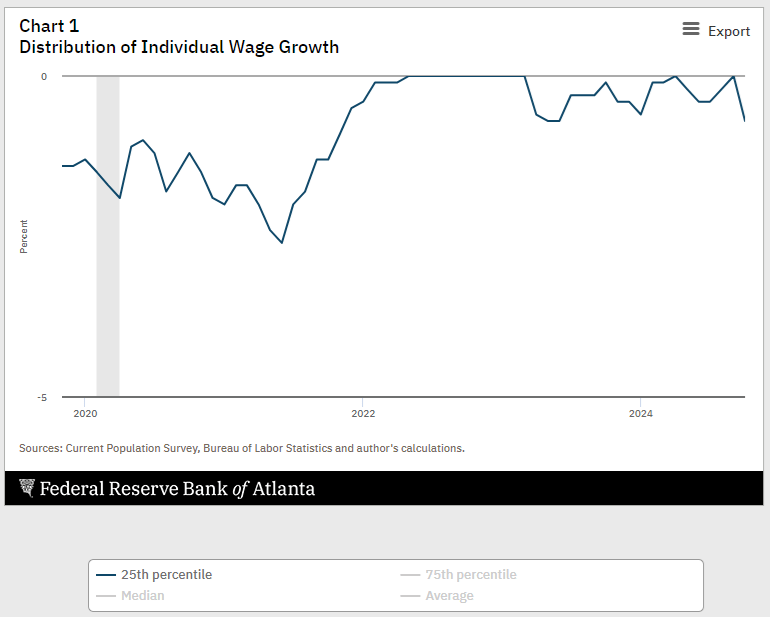
How are 25% of workers getting nominal pay cuts every month? Are employers really cutting wages? Of course not. Nominal hourly wage cuts are extremely rare. Instead, it is probably a quirk of how they calculate it (for some workers they use weekly wages and divide it by “usual hours per week” which might fluctuate in ways that pull the hourly down, even if it didn’t decline), plus it includes workers that have variable income other than hourly pay, such as those working on commission or earning tips.
If instead we use median wage growth in the bottom quartile (bottom 25%) from the exact same source, we see that nominal growth is always positive over the same time period: though certainly less than inflation in some periods!
Bottom Line
My bottom line on this is similar to Mazlich (despite him putting me in the optimist camp!), with the caveat about 2024 annual income not yet being available.
- Real wage growth was positive under Biden
- But real wage growth was below trend and recent presidencies
- Real annual income growth is probably also positive under Biden (once we have 2024 data), but also weak compared to trend
- But this is not necessarily Biden’s fault (baseline is weird), and it’s actually better than most peer countries
Finally, as I said about 1 year ago, I think the real problem is money illusion: voters probably aren’t actually comparing their incomes from 4 years ago with their receipts from 4 years ago. Nominal prices are much higher, and it stinks.

I think people are looking at their receipts…
https://www.reddit.com/r/mildlyinfuriating/comments/yd8bf1/walmart_receipt_from_almost_3_years_ago_milk_is/
https://www.reddit.com/r/LateStageCapitalism/comments/y0t6wo/4_inflation_fee_on_top_of_the_inflation_price/
https://www.reddit.com/r/AlamoDrafthouse/comments/1g89dej/found_an_old_receipt_from_2020_them_were_the_days/
https://www.reddit.com/r/Superstonk/comments/prvy0f/i_keep_all_my_receipts_because_im_an_accountape_i/
LikeLike
Only the 4th Reddit post actually provides a comprehensive accounting of their receipt. Some prices are up, some are down, many are unchanged.
I went through that data and calculated the overall increase: it was only 1.9% (3.8% if you exclude the bottom three non-food items).
People tend to focus on the things that are up 30%, but not the overall increase. My exact point!
LikeLike
Four Reddit posts aren’t comprehensive of anything; the point was the content and engagement itself being evident (at least, somewhat so) that people are actually thinking about these things in a comparative way.
And that’s to say nothing of the personal finance communities more broadly, who keep detailed annual budgets track their spending, and absolutely make the mentioned comparisons between incomes and budget categories.
LikeLike
Good stuff.
Furthermore, I’ve been wondering what the distribution of net income growth is within each income quintile. I want to say that it’s mostly positive with some negative in all quintiles, but your post makes me think that there’s more going on in the bottom quintile.
LikeLike