Did president Trump’s first term tariffs, enacted in 2018, increase manufacturing employment or even just manufacturing output? Let’s set the stage.
Manufacturing employment was at its peak in 1979 at 19.6 million. That number declined to 18m by the 1980s, 17.3m in the 1990s. By 2010, the statistics bottom out at 11.4m. Since then, there has been a rise and plateau to about 12.8m if we omit the pandemic.
Historically, economists weren’t too worried about the transition to services for a while. After all, despite falling employment in manufacturing, output continued to rise through 2007. But, after the financial crisis, output has been flat since 2014, again, if we omit the pandemic. Since manufacturing employment has since risen by 5% through 2025, that reflects falling productivity per worker. That’s not comforting to either economists or to people who want more things “Made in the USA”.
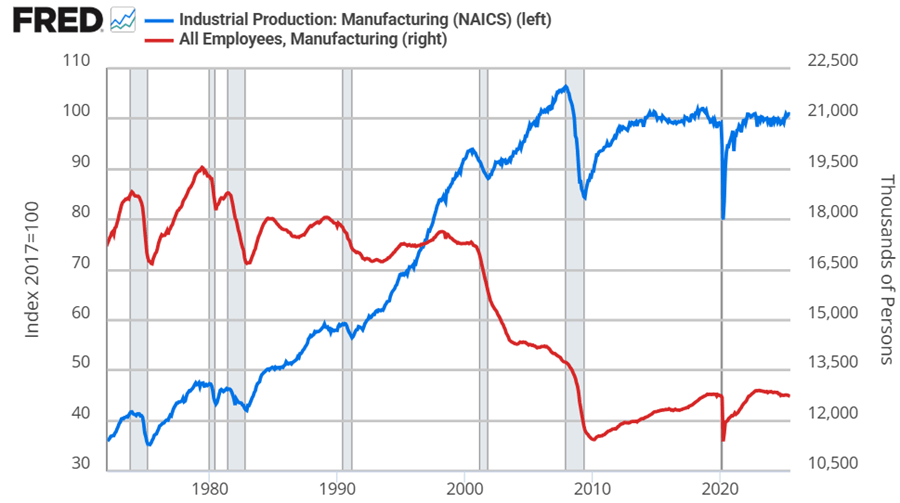
Looking at the graphs, there’s no long term bump from the 2018 tariffs in either employment or output. If you squint, then maybe you can argue that there was a year-long bump in both – but that’s really charitable. But let’s not commit the fallacy of composition. What about the categories of manufacturing? After all, the 2018 tariffs were targeted at solar panels, washing machines, and steel. Smaller or less exciting tariffs followed.
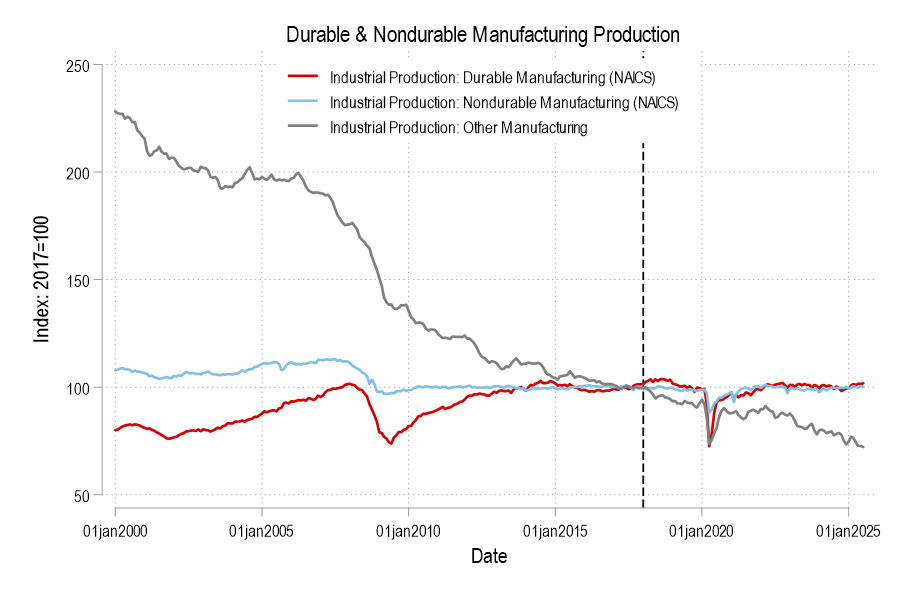
Breaking it down into the major manufacturing categories of durables, nondurables, and ‘other’ (which includes printed material and minimally processed wood products), only durable manufacturing output briefly got a bump in 2018. But we can break it down further.
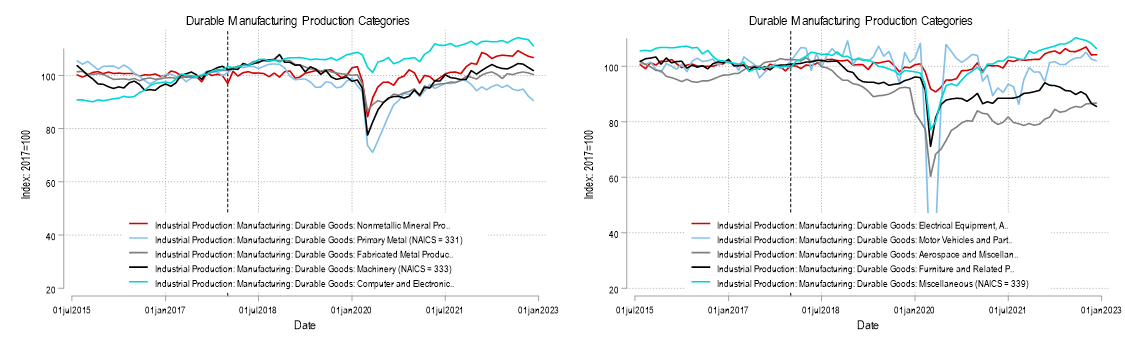
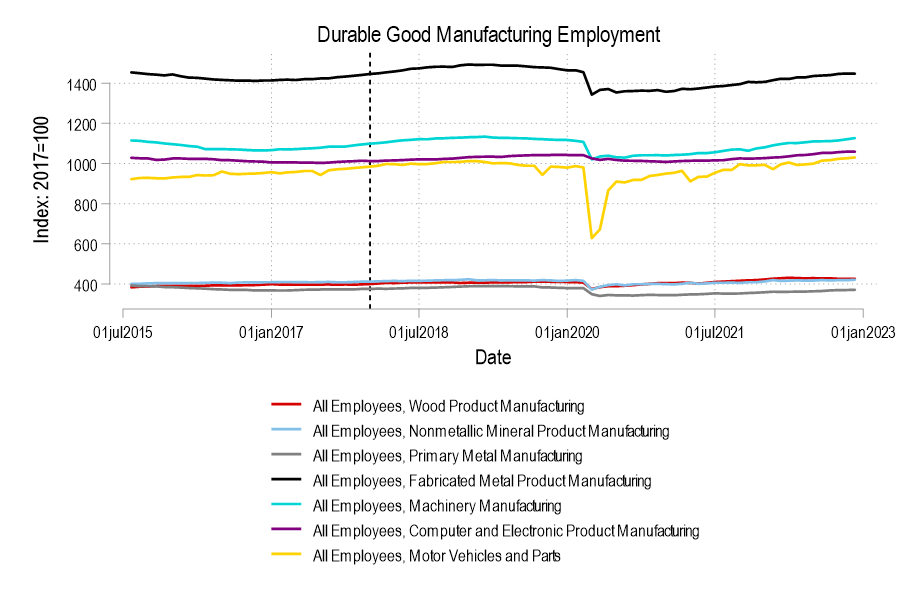
There are 10 categories of durables, so you may need to squint again. Nothing here is a raging success for the 2018 tariffs. Maybe some types of durable manufacturing elevated briefly by a smidge, but everything looks about as volatile or on trend as it did prior to 2018. The only exception is motor vehicles, for which production became much more volatile even prior to the pandemic. What about non-durable manufacturing? Given that tariffs were on steel, then maybe the bump in plastics and rubber output was related. But if we zoom out, then we’d see that it’s on track with a very slow increase in that category’s output at least since 2011.

What about employment? Breaking down manufacturing employment into durables and nondurables reveals that the durable employment was rising prior to the tariffs. But maybe the tariffs helped to solidify those employment gains? Another dive.
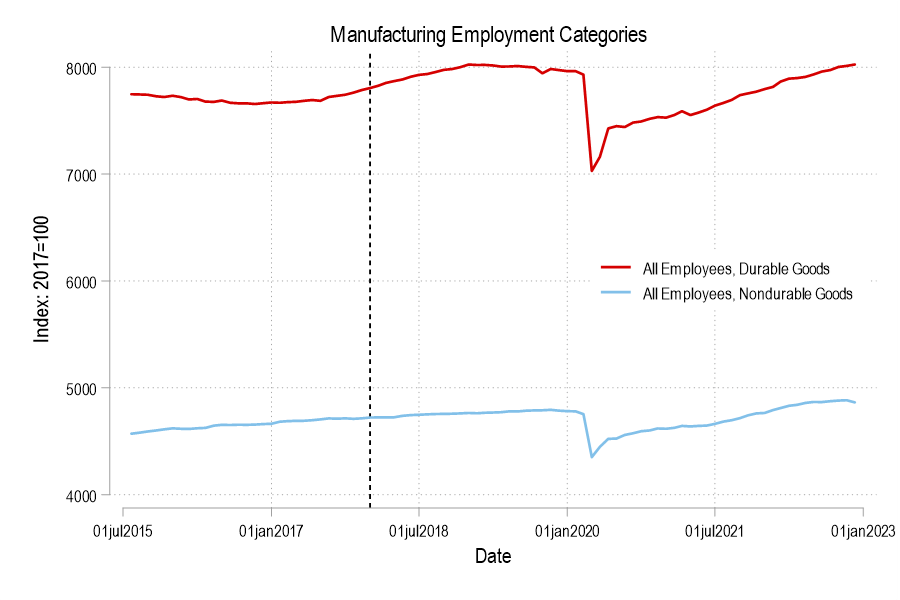
Breaking it down, it appears that fabricated metals and machinery manufacturing employment did get a bump – though not a big one.
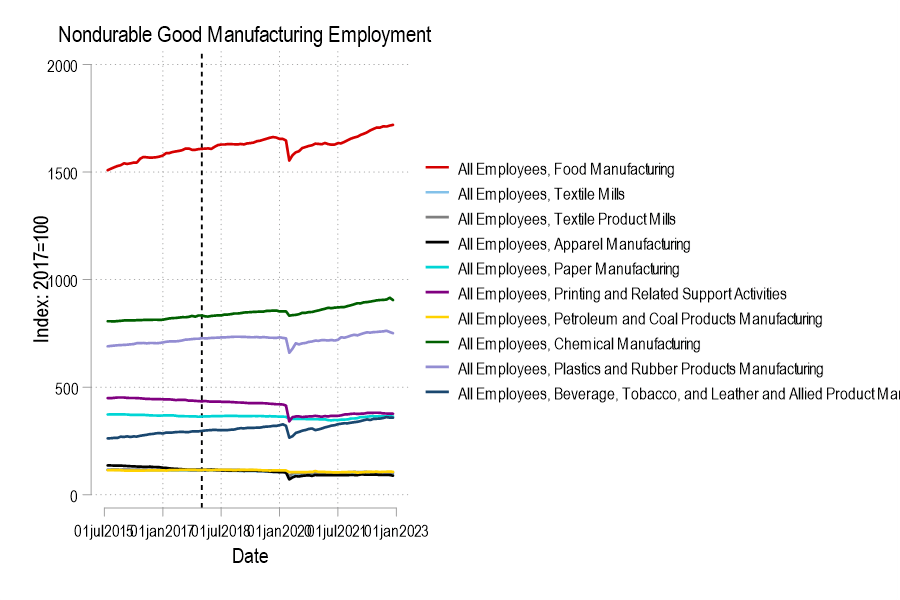
For the various non-durable goods employment, there is no deviation from existing trends.
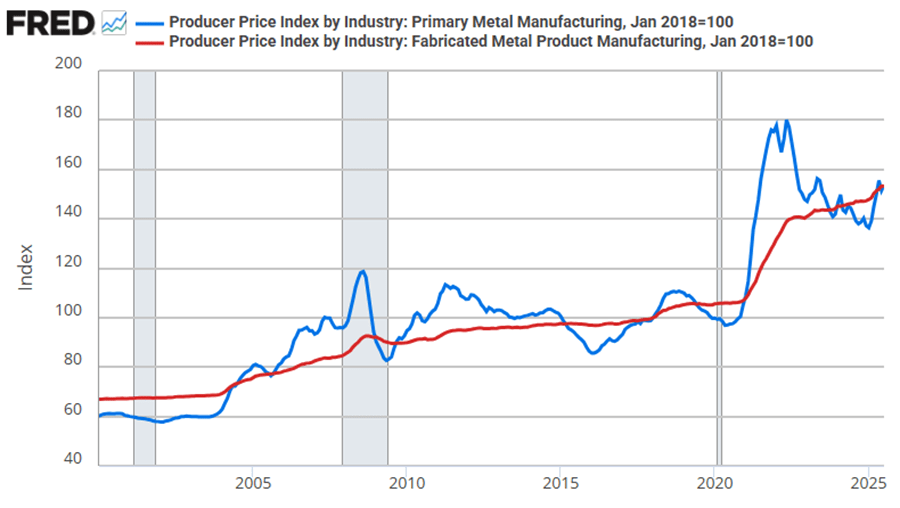
In conclusion, there is mild evidence that tariffs increased output or employment in fabricated metal and machinery employment and output. Other industries in aggregate saw squat in terms of output and employment. What else did we get in the primary and fabricated metal manufacturing sectors? By November of 2018, w got higher prices by 10.8% & 4.7% respectively.
All Series from FRED:
IPDMAN IPNMAN IPG311A2S IPG313A4S IPG315A6S IPG322S IPG323S IPG324S IPG325S IPG326S IPG327S IPG331S IPG332S IPG333S IPG334S IPG335S IPG3361T3S IPG3364T9S IPG337S IPG339S IPGMFOS CES3132100001 CES3132700001 CES3133100001 CES3133200001 CES3133300001 CES3133400001 CES3133410001 CES3133420001 CES3133440001 CES3133450001 CES3133500001 CES3133600001 CES3133600101 CES3133700001 CES3133900001 CES3231100001 CES3231300001 CES3231400001 CES3231500001 CES3232200001 CES3232300001 CES3232400001 CES3232500001 CES3232600001 CES3232900001 DMANEMP NDMANEMP PCU332332 PCU331331

Any speculation on why manf productivity has declined? Millennial slackers, or are different things being made in different venues? (e.g. smaller scale specialty fabrication, vs. mass scale factory goods which are nearly impossible to compete with China?)
LikeLike
We have some idea. We know that rising employment and falling average labor productivity is consistent with greater use of labor along a stable production function. In other word, technological improvement has been slow. We also know that services have dominated US consumption and that manufacturing requires big investment. Therefore, it’s sensible that investment and innovation would more greatly emphasize the more easily scalable sectors that have lower barriers. But that’s just spit-balling. In some sense, once everyone has enough to eat, growth in manufacturing is somewhat harder to expand. But services can be provided more or less without satiation at low marginal cost to consumers.
LikeLike