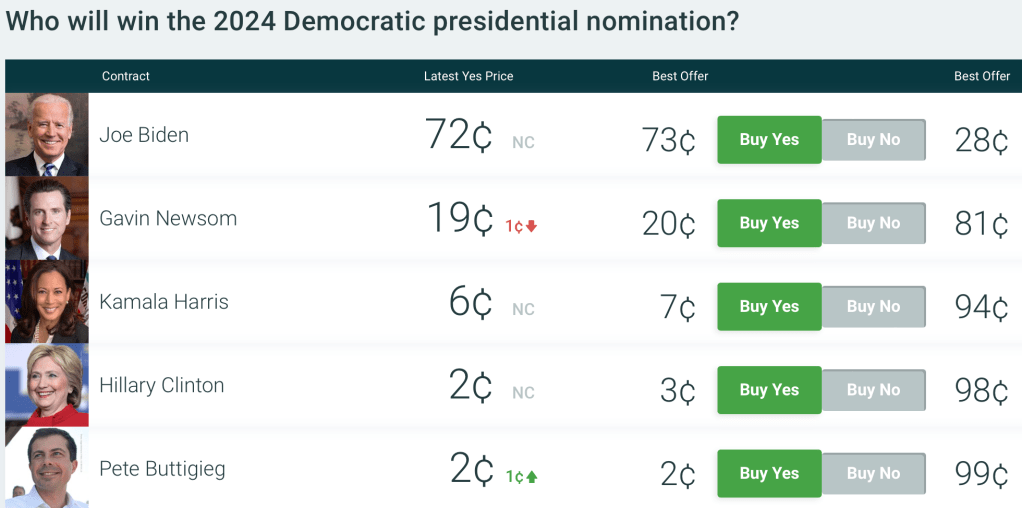
President Biden winning the Democratic nomination is currently priced at 72 cents on PredictIt, implying a roughly 72% chance of winning the nomination. Not the general 2024 election- where he is priced at a mere 43 cents- but the Democratic nomination.
To me it seems crazily underpriced to put the odds of an incumbent president being renominated by his own party at only 72%. Yes, his approval ratings are underwater, and yes he’s old, but the base rates here very much work the other way. No incumbent president has lost a vote to be renominated since Chester Arthur in 1884. It think its extremely unlikely Biden would run for nomination and lose; it makes more sense that he would choose not to run, like LBJ in 1968, but I see no indications of that.
I think Biden will only fail to be renominated if he dies or experiences a major decline in his health by the convention next August. This is certainly possible for an 80 year old but the odds of it are well below the 28% implied by PredictIt. A recent WSJ article lays out the details:
a nonsmoking male with Biden’s birthday, in good health, would be expected to live nine more years after next year’s Election Day, while for one with Trump’s birthday, it would be 11 years.
WSJ focuses on his chance of finishing a second term and doesn’t give an estimate for just making it to renomination, but my own look at actuarial tables shows that the average 80 year old has only a 6.5% probability of dying within a year. The chance of dying or getting a disabling health condition in a year is of course higher than that, but the convention is actually less than a year away in August, and the primaries will be done by June. Plus the WSJ article gives several reasons to think Biden is in better health than the average 80 year old:
First, the median includes people who drink alcohol. Regular drinking of two or more drinks, three or more times a week, shortens life expectancy by about seven years. Both Trump and Biden are teetotalers, in addition to being nonsmokers.
“Those are two of the biggest killers right there,” said Bradley Willcox, a professor and research director at the Department of Geriatric Medicine at the University of Hawaii. “When you eliminate excessive alcohol intake and smoking, one thing you’re left with is genetics.”
Here, Trump and Biden picked their parents well. Trump’s mother lived to 88 and his father to 93, though late in life he developed Alzheimer’s disease. Biden’s mother died at 92—living long enough to see her son become the sixth-oldest vice president. Joe Biden Sr. died at 86. That is even more impressive than it sounds: When those four individuals were born, life expectancy was around 50.
Biden and Trump are each highly educated at a time when the life-expectancy gap between the educated and uneducated has been growing. They are wealthy, also a strong predictor of longer life. They receive excellent healthcare.
Add it all up and I think Biden has over a 90% chance of being renominated, so being able to bet on him at 72 cents seems like a great deal (even if it means tying up money that could now earn 5% interest elsewhere). PredictIt has betting limits and high withdrawal fees, but other prediction markets are in the same ballpark; Polymarket currently has Biden at 75c.
For similar reasons Trump is may also be underpriced to win the nomination, currently at 68 cents on PredictIt. He’s not an incumbent the same way, but he’s enough of one that I don’t think any of his electoral opponents can beat him for the nomination; he’d have to beat himself by dying or withdrawing (very unlikely), or be beaten by the legal system (he’ll continue to have trouble but I don’t think it will be enough to get him disqualified or in prison by the June convention).
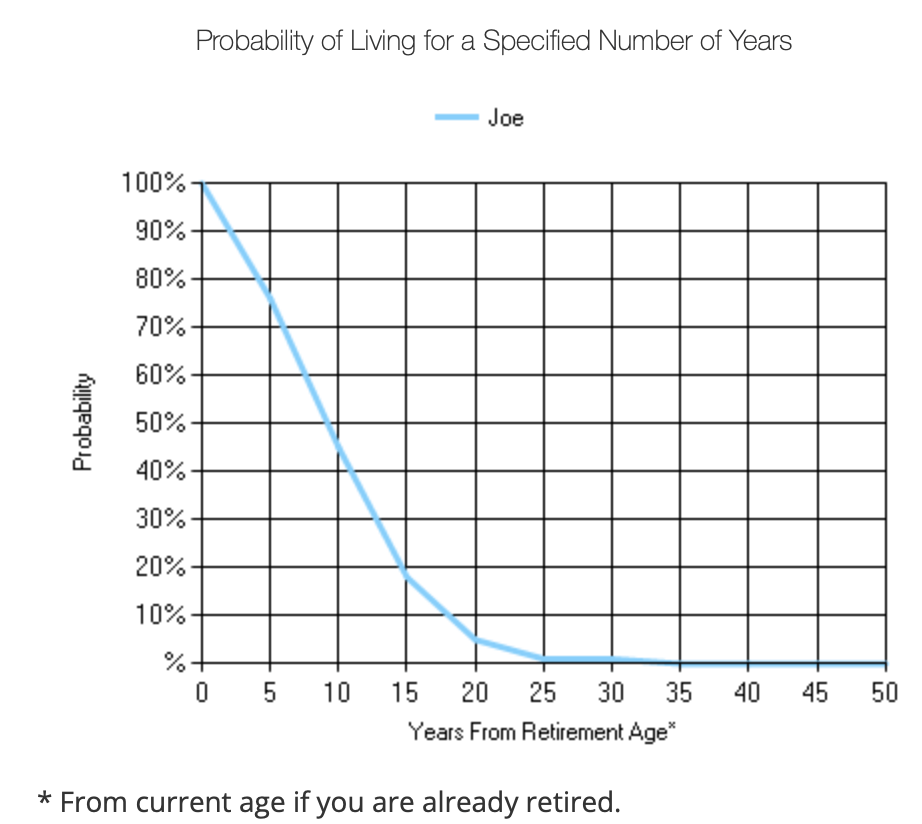
It’s boring and its not my preference, but I think we are headed for a rematch of 2020. On the bright side, 80 isn’t what it used to be:
Disclaimer: Not investment advice. I did put my money where my mouth is here, and so am now talking my book