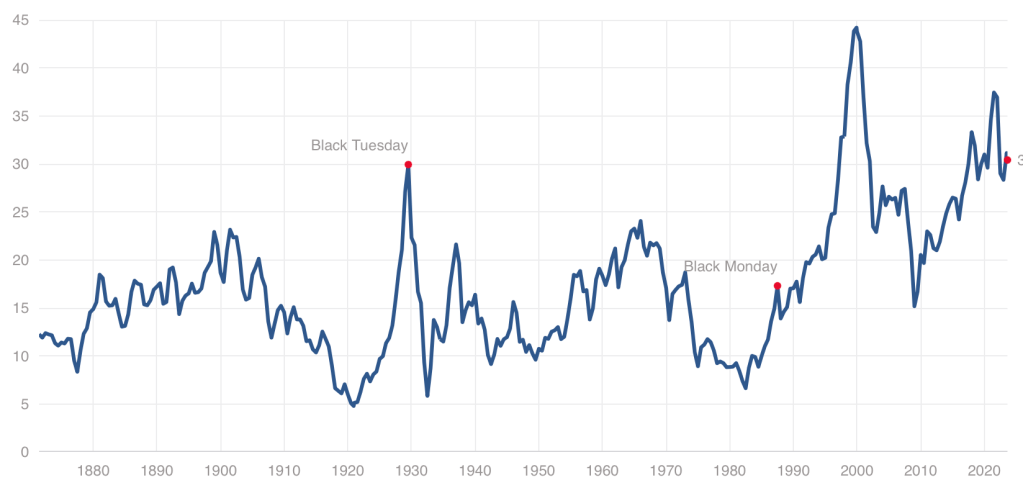
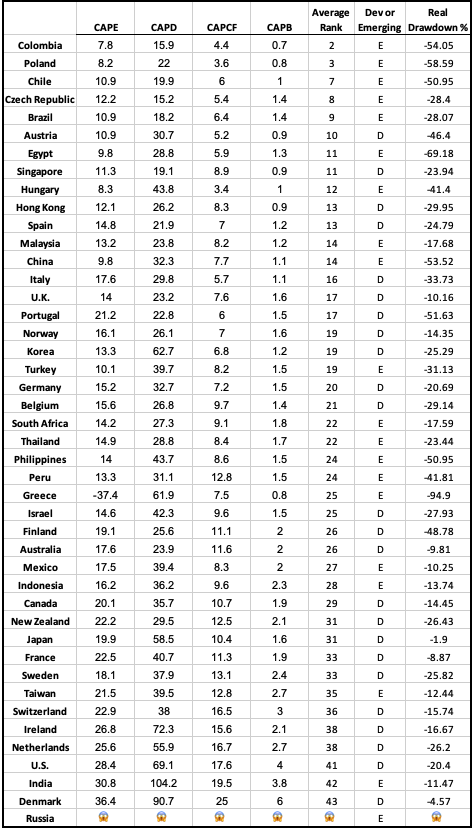
Bill Gross grew PIMCO into a trillion dollar company by trading bonds, earning the epithet “Bond King“. But in an interview with Odd Lots this week, he disclaims both bonds and his title. He wasn’t the king:
My reputation as a bond king was first of all made by Fortune. They printed a four page article with me standing on my head doing yoga, and I was supposedly the bond king, and that was good because it sold tickets. But I never really believed it. The minute you start believing it, you’re cooked.
Who is the real bond king? The Fed:
The bond kings and queens now are are at the Fed. They rule, they determine for the most part which way interest rates are going.
Who still isn’t the bond king? Any other trader, especially Jeff Gundlach:
To be a bond king or a queen, you need a kingdom, you need a kingdom. Okay, Pimco had two trillion dollars. Okay, DoubleLine’s got like fifty five billion. Come on, come on, that’s no kingdom. That’s like Latvia or Estonia whatever. Okay, and then then look at his record for the last five, six, seven years. How does sixtieth percentile smack of a bond king? It doesn’t.
Why he doesn’t believe in long-term bonds right now:
We have a deficit of close to two trillion. The outstanding treasury market is about 33 trillion… about thirty percent of the existing outstanding treasuries, so ten trillion have to be rolled over in the next twelve months, including the two trillion that’s new. So that’s that’s twelve trillion dollars. Where the treasuries that have to be financed over the next twelve months, and who’s going to buy them at these levels? Well, some people are buying them, but it just seems to be a lot of money. And when you when you add on to that, Powell is doing quantitative tightening, as you know, and that theoretically is a trillion dollars worth of added supply, I guess. And so it just seems like a very dangerous time based on supply, even if inflation does comedown.
By revealed preference I agree with Gross, in that I don’t own any long-term bonds. Their yields are way up from 2 years ago, making them somewhat tempting, but I can get higher yields on short-term bonds, some savings accounts, and some stocks. So I see no reason to go long term, especially given the factors Gross highlights. If he’s right, better long-term yields will be here in a year or two. If he turns out to be wrong, I think it would be because of a severe recession here or in another major economy, but I don’t expect that. So what is Gross buying instead of bonds? He likes the idea of real estate:
All all my buddies at the country club are in real estate, and they’ve never paid a tax in their life…. I’ve paid a lot of taxes.
He landed on Master Limited Partnerships, common in the energy sector, as an easier way to avoid taxes, and has 40% of his wealth there. Those are yielding more like 9% and have the tax benefits, though they are risker than treasury bonds. The rest of his portfolio he implies is in stocks, describing some merger arbitrage opportunities. I am a bit tempted by bonds because they’ve done so badly recently (and so have gotten much cheaper), but like Gross I think we’re still not to the bottom.
Short post today because I’m busy watching my kids, who had their school canceled because of excessive heat, like many schools in Rhode Island today.
I thought this was a ridiculous decision until my son told me he heard from his teacher that his elementary school is the only one in town that has air conditioning for every classroom. Given that, the decision to cancel given the circumstances is at least reasonable, but the lack of AC is not.
It’s not just that hot classrooms are unpleasant for students and staff, or that sudden cancellations like this are a major burden for parents. Several economics papers have found that air conditioning significantly improves students’ learning as measured by test scores (though some find not). Park et al. (2020 AEJ: EP) find that:
Student fixed effects models using 10 million students who retook the PSATs show that hotter school days in the years before the test was taken reduce scores, with extreme heat being particularly damaging. Weekend and summer temperatures have little impact, suggesting heat directly disrupts learning time. New nationwide, school-level measures of air conditioning penetration suggest patterns consistent with such infrastructure largely offsetting heat’s effects. Without air conditioning, a 1°F hotter school year reduces that year’s learning by 1 percent.
This can actually be a bigger issue in somewhat Northern places like Rhode Island- we’re South enough to get some quite hot days, but North enough that AC is not ubiquitous. Data from the Park paper shows that New York and New England are actually some of the worst places for hot schools:
This is because of the lack of AC in the North:
The days are only getting hotter…. it’s time to cool the schools.
I’ve seen plenty of investigations of “Long Covid” based on surveys (ask people about their symptoms) or labs (x-ray the lungs, test the blood). But I just ran across a paper that uses insurance claims data instead, to test what happens to people’s use of medical care and their health spending in the months following a Covid diagnosis. The authors create some nice graphics showing that Long Covid is real and significant, in the sense that on average people use more health care for at least 6 months post-Covid compared to their pre-Covid baseline:
The graph is a bit odd in that its scales health spending relative to the month after people are diagnosed with Covid. Their spending that month is obviously high, so every other month winds up being negative, meaning just that they spent less than the month they had Covid. But the key is, how much less? At baseline 6 months prior it was over $1000/month less. The second month after the Covid diagnosis it was about $800 less- a big drop from the Covid month but still spending $200+/month more than baseline. Each month afterwards the “recovery” continues but even by month 6 its not quite back to baseline. I’m not posting it because it looks the same, but Figure 4 of the paper shows the same pattern for usage of health care services. By these measures, Long Covid is both statistically and economically significant and it can last at least 6 months, though worried people should know that it tends to get better each month.
I was somewhat surprised at the size of this “post Covid” effect, but much more surprised at the size of the “pre Covid” or “early Covid” effect- the run-up in spending in the months before a Covid diagnosis. For the month immediately before, the authors have a good explanation, the same one I had thought of- people are often sick with Covid a couple days before they get tested and diagnosed:
There is a lead-up of healthcare utilization to the diagnosis date as illustrated by the relatively high utilization levels 30–1 days before diagnosis. This may be attributed to healthcare visits only days prior to the lab-confirmed infection to assess symptoms before the manifestation or clinical detection of COVID-19.
But what about the second month prior to diagnosis? People are spending almost $150/month more than at the 6-month-prior baseline and it is clearly statistically significant (confidence intervals of months t-6 and t-2 don’t overlap). The authors appear not to discuss this at all in the paper, but to me ignoring this lead-up is burying the lede. What is going on here that looks like “Early Covid”?
My guess is that people were getting sick with other conditions, and something about those illnesses (weakened immune system, more time in hospitals near Covid patients) made them more likely to catch Covid. But I’d love to hear actual evidence about this or other theories. The authors, or someone else using the same data, could test whether the types of health care people are using more of 2 months pre-diagnosis are different from the ones they use more of 2 months post-diagnosis. Doctors could weigh in on the immunological plausibility of the “weakened immune system” idea. Researchers could test whether they see similar pre-trends / “Early Covid” in other claims/utilization data; probably they have but if these pre-trends hold up they seem worthy of a full paper.
I’m looking for a new car now and would like to know what the safest reasonable option is. There are lots of ways to get some information about this, but none are very good.
The government provides safety ratings based on crash tests they perform. This is better than nothing but the crash tests only test certain things and don’t necessarily tell you how a car performs in the real world. They also have a habit of just giving their top rating (5 stars) to tons of vehicles so it doesn’t help you pick between them, and they only compare cars to other cars in the same “class”, ignoring that some classes are safer than others. On top of all the problems with the ratings themselves, they also don’t provide any lists of their ratings, instead making you search one car at a time.
Several other sites improve on the government ratings by using real-world data on how often cars actually crash (much of which comes from the government, which as usual is great at collecting data but not so great at presenting it in helpful user-friendly ways). The Auto Professor grades cars using real-world data but otherwise has the same problems as the government (NHTSA) site. Cars get letter grades rather than a rank or meaningful number, so it’s not actually clear which car is best, or how much better the good cars are than the average or bad cars. You can search the grades for one car at a time but they don’t just list the safest cars anywhere, including on their page labelled “safest cars list“.
The Insurance Institute for Highway Safety uses real world data and provides actual numbers of fatality rates for different vehicles. This is great because you don’t have the problem of “dozens of cars all have 5-star / A, which is best?” or the problem of “how much better is 5 star than 4 star, or A than B?”. But they don’t include data from the 2 most recent years, and they only post their ratings for a handful of cars. Not only do they not present a complete list, they seem to have no search function whatsoever for their real-world data (they do for their NHSTA-style crash test data). Some 3rd party sites seem to have posted more complete versions of their data, but it still doesn’t show data for most car models.
The least-terrible car safety site I have found is Real Safe Cars. The good: they use real-world safety data, they apply reasonable-sounding corrections and controls do it, they present meaningful quantitative measures like “vehicle lifetime fatality chance” and “vehicle lifetime injury chance”, and they present the data using both a search function and lists of “safest vehicles”. For 2020 you can see that the #1 car, the 2020 Audi e-tron Sportback, has a vehicle lifetime fatality chance of 0.0158%. Compare this to the #100 car, which is about average overall- the 2020 Acura TLX has a vehicle lifetime fatality chance of 0.0435% (almost 3x the safest). The site makes it hard to find the very worst car but near the bottom is the 2020 Hyundai Accent, which “has a vehicle lifetime fatality chance of 0.0744%”.
The lists could be better; the only list that includes all vehicle classes is restricted to only 2020 makes. Meanwhile when you search a car it ranks it only relative to cars in the same year, though you can make comparisons across years yourself using the quantitative “fatality chance” and “injury chance” measures. I’m not totally convinced of the ratings themselves, given how well many smaller sedans do. Their front page explains how taller cars are generally safer, but also lists the Mini Cooper as the #18 safest car of 2020 across all classes. But Real Safe Cars seems like the current best site to me (maybe I’m biased since one of its creators is an economics professor).
I hope these sites will address some of the weaknesses I identified here, though I’m not optimistic about most of them, because other than Real Safe Cars the “bad” decisions seem to be clearly driven by incentives like keeping car companies happy or SEO.
I also think there’s still room for another effort by economists or other quantitatively-skilled people to make another site. The underlying crash data is public and the statistical problems are not especially hard; I think a single economist could run the numbers in about the time it takes to write a typical economics paper (weeks to months for a 1st draft), and a decent website could be built off that quickly as well. You could probably make a decent amount of money off the site, though perhaps not if you do the right thing and publicly post all the data and code. Posting the data would make it easy for others to copy you and make their own sites. You could fight that with copyright, but given the huge public good aspect here and the lives at stake it might make more sense to get grant funding up front and then make the data and code totally public. A sane world would have done this already; NHTSA’s annual budget is over $1 billion, with $35 million of that going to research and analysis. I think any decent funder should be able to do at least as well as the sites above with under $200k, or anyone with good data chops could do it out of the goodness of their heart in a few months. I don’t have a few months right now but perhaps one of you could take this up or start applying for grants to do it.
For everyone who just wants to know about which cars are safe, for now I think Real Safe Cars is the best bet, though I’d also like to hear if you think I missed anything.
While we have stepped back from the meme stock craziness of 2021, US stocks remain quite expensive by historical standards, with our Cyclically Adjusted Price to Earnings (CAPE) ratio at almost twice its long-run average:
Even at a high price, US stocks could still be worth it, and I certainly hold plenty. But I also think it it a good time to consider the alternatives. US Treasury bond yields are the highest they’ve been since 2007. But there are also many countries where stocks are dramatically cheaper than the US- and not just high-risk basket-cases, but stable “investable” countries.
There are several reasonable ways to measure what counts as “expensive” for stocks in addition to the CAPE ratio I mention above. The Idea Farm averages out four such measures to determine how expensive different “investable” (large, stable) country stock markets are. Here is their latest update:
You can see that US stocks are expensive not only relative to our own history, but also relative to other countries, lagging only India and Denmark. That means that much of the world looks like a relative bargain, with the cheapest countries being Colombia, Poland, Chile, Czech Republic, and Brazil.
Of course, sometimes stocks, just like regular goods and services, are cheap for a reason: they just aren’t that good. They might be cheap because investors expect slow growth, or a recession, or political risk. But if you don’t share these expectations about a cheap stock (or country), that’s when to really take a look. I certainly did well buying Poland after I saw they were the cheapest in last year’s global valuation update and thought there was no good reason for them to stay that cheap.
I like that the chart above provides a simple ranking of investable markets. But if you wish it included more valuation measures, or small frontier markets, you can find that from Aswath Damodaran here. Some day I hope to provide a data-based, rather than vibes-based, analysis of which countries are “cheap/expensive for a reason” vs “cheap/expensive for no good reason”, featuring measures like industry composition, population growth, predictors of economic growth, and economic freedom. For now you just get my uninformed impression that Poland and Colombia seem like fine countries to me.
Disclosure: I’m long stocks or indices in several countries mentioned, including EPOL, FRDM, PBR.A, CIB, and SMIN. Not investment advice.
Inpatient costs were 27% higher (95% CI 0.252, 0.285), but length of stay was 12% shorter (95% CI −0.131, −0.100), in Comprehensive Cancer Centers relative to community hospitals.
In other words, these cutting-edge hospitals that tend to treat complex cases are more expensive, as you would expect; but despite getting tough cases they actually manage a shorter average length of stay. We can’t nail down the mechanism for this but our guess is that they simply provide higher-quality care and make fewer errors, which lets people get well faster.
The NCI Cancer Centers Program was created as part of the National Cancer Act of 1971 and is one of the anchors of the nation’s cancer research effort. Through this program, NCI recognizes centers around the country that meet rigorous standards for transdisciplinary, state-of-the-art research focused on developing new and better approaches to preventing, diagnosing, and treating cancer.
Our paper focuses on New York state because of their excellent data, the New York State Statewide Planning and Research Cooperative System Hospital Inpatient Discharges dataset, which lets us track essentially all hospital patients in the state:
We use data on patient demographics, total treatment costs, and lengths of stay for patients discharged from New York hospitals with cancer-related diagnoses between 2017 and 2019.
You know I’m all about sharing data; you can find our data and code for the paper on my OSF page here.
My coauthor on this paper is Ryan Fodero, who wrote the initial draft of this paper in my Economics Senior Capstone class last Fall. He is deservedly first author- he had the idea, found the data, and wrote the first draft; I just offered comments, cleaned things up for publication, and dealt with the journal. I’ve published with undergraduates several times before but this is the first time I’ve seen one of my undergrads hit anything close to a top field journal. You can find a profile of Ryan here; I suspect it won’t be the last you hear of him.
90 plus per cent of people, they spend all their time on the buy decision and then they figure it out as they go along on when to sell and we say that’s crazy. You need to establish sell criteria, even if it’s just rebalance, even if it’s a trailing stop, whatever it may be on all your public market positions, because otherwise it gets emotional and that creates huge problems.
Last week I explained why I buy individual stocks. This week I’ll share how I think about when to sell individual stocks, as I go through my portfolio and decide what to hold and what to sell. This is the first time I’m doing this exercise, though I should have done it long ago; until now I’ve unfortunately been on the wrong side of the above Meb Faber quote.
I actually think that most people are correct not to put much thought into what to sell, because I still agree with Buffett and most economists that most people should just buy and hold diversified index funds. Thinking about selling too much might lead people to sell everything whenever they get worried, sit in cash, and miss out on years of gains. But the important truth in Faber’s point is that if you are buying stocks or active funds for any reason other than “its a great company/idea that I’d like to hold indefinitely”, it makes sense to put as much thought into when/whether to sell as when/whether to buy.
People buy stocks all the time based on short-term arguments like “this banking crisis is overblown”, or “I think the Fed is about to cut rates”, or “this IPO is going to pop”, or “I think the company will beat earnings expectations this quarter”. These might be good or bad arguments to buy but they are all arguments about why it makes sense to hold a certain stock for weeks or months, not for years or indefinitely.
But people often buy a stock for short-term reasons like these, then hold on to it long term- either out of inertia, or because they grow attached to it, or because it lost money and they want to hold until it “makes it back” (sunk cost fallacy). None of these reasons really make sense; they might work out because buying and holding often does, but at that point you might as well be in index funds. If you’re going to be actively trading based on ideas, it makes sense to sell once you know whether your idea worked or not (e.g., did the company you thought would beat earnings actually do it) to free up capital for the next idea (unless you genuinely have a good new idea about the same stock, or you think it makes sense to hold onto it a full year to hit long-term capital gains tax). Its also always fair to fight status quo bias and ask “would I buy this today if I didn’t already own it?” (especially if its in a non-taxable account).
Maybe this is obvious to you all, and writing it out it sounds obvious to me, but until now I haven’t actually done this. For instance, I bought Coinbase stock at their IPO because I thought it would trade up given the then-ongoing crypto / meme stock mania. I was correct in that the $250 IPO started trading over $300 immediately; but then I just held on for years while it fell, fell, fell to below $100. The key difference I’m trying to get at here is the one between ideas and execution: its not that I thought Coinbase had such good fundamentals that it was a good long term buy at $250 and my idea was wrong; instead I had a correct short-term idea of what would happen after the IPO, but incorrectly executed it as if it were a long-term idea (mostly through inertia, not paying attention, and not putting in an immediate limit sell order at a target price after buying).
So if you buy stocks for short- or medium-term reasons, it makes sense to periodically think about which to sell. I’ll show how I I think about this by going through some examples from my own current portfolio below (after the jump because I think the general point above is much more important that my thinking on any specific stock, which by the way is definitely not investment advice):
The conventional wisdom among economists is that large, liquid asset markets like the US stock market are incredibly informationally efficient. The Efficient Market Hypothesis (EMH) means that these markets near-instantly incorporate all publicly available information, making future prices essentially impossible to predict (a random walk with drift). As a result, economists’ investment advice is that you shouldn’t try to beat the market, because its impossible except through luck; instead you should aim to tie the market by owning most all of it via diversified low-fee index funds (e.g. SPY or VT).
This idea usually sounds crazy when people first hear it, but it works surprisingly well. You’d think that at least half of participants would beat the market average each year, but active strategies can generate such high fees that its actually much less than that. Further, people who beat the market one year aren’t more likely than average to beat it the next, suggesting that their winning year was luck rather than skill. Even Warren Buffet, who economists will sometimes concede is an exception to this rule, thinks that it is best for the vast majority of people to behave as if the EMH is true:
In 2008, Warren Buffett issued a challenge to the hedge fund industry, which in his view charged exorbitant fees that the funds’ performances couldn’t justify. Protégé Partners LLC accepted, and the two parties placed a million-dollar bet.
Buffett has won the bet, Ted Seides wrote in a Bloomberg op-ed in May. The Protégé co-founder, who left in the fund in 2015, conceded defeat ahead of the contest’s scheduled wrap-up on December 31, 2017, writing, “for all intents and purposes, the game is over. I lost.”
Buffett’s ultimately successful contention was that, including fees, costs and expenses, an S&P 500 index fund would outperform a hand-picked portfolio of hedge funds over 10 years. The bet pit two basic investing philosophies against each other: passive and active investing.
This has been the approach I’ve taken for most of my life, but over the last 3 years I’ve gone from ~99% believing in efficient markets to perhaps ~80%. Missing on crypto felt forgivable, since it was so new and unusual; I recognized that in the early days of a small, illiquid market the EMH might not apply, I just misjudged what counted as “early days” (I figured that by 2011 “everyone” knew about it because Bitcoin had been discussed on Econtalk; its up ~1000x since).
But with the Covid era the anomalies just kept piling up. All through February 2020, the smart people on Twitter were increasingly convincing me that this would be a huge pandemic; the main thing reassuring me was that stocks were up. But by late February they finally started crashing; instead of trusting the markets, I apparently should have trusted my own judgement and bought puts. Then investors starting buying the “wrong” Zoom instead of the one whose business benefitted from Covid:
Then we saw “meme stock mania” with many stocks spiking for reasons clearly unconnected with their fundamental value. Many at Wall Street Bets were clear that they were buying not because of business fundamentals, or even because they thought the price would go up, but because they liked the company, or wanted to be part of a movement, or wanted to send a message, or “own the shorts”.
Anecdotes got me to start taking some of the anti-EMH economics literature more seriously. For instance, Robert Shiller’s work showing that while it might be near-impossible to predict what a single stock will do tomorrow better than chance, predicting what the overall market will do over the longer run is often possible.
By revealed preference, is still mostly buy the EMH. About 80% of my net worth (not counting my home) is in diversified low-fee index funds. But that means 20% isn’t; its in individual stocks or actively traded ETFs with more-than-minimal fees. Why do this? I see 4 reasons buying individual stocks isn’t crazy:
Free trading: Buying a bunch of individual stocks used to incur huge fees. Now, many brokerages offer free trading. Even if the EMH is true, buying a bunch of individual stocks won’t lose me money on average, just time.
Still diversified: Buying into active funds instead of passive ones does tend to mean higher fees, and that is a real concern, but they do still tend to be quite diversified. Even buying individual stocks can leave you plenty diversified if you buy enough of them. Right now I hold about 45, with none representing more than 0.5% of my portfolio; one of them going bankrupt causes no problems. If anything I’m starting to feel over-diversified, and that I should concentrate more on my highest-conviction bets.
Learning: Given the above, even if the EMH is 100% true, my monetary losses due to fees and under-diversification will be tiny. The more significant cost is to my time- time spent paying attention to markets and trading. This is a real cost, enough that I think anyone who finds this stuff boring or unpleasant really should take the conventional econ advice of putting their money in a diversified low-fee index fund and forgetting about it. But I’m starting to find financial markets interesting, and I think keeping up with markets is a great way to learn about the real economy- they always suggest questions about why some companies, sectors, factors, or countries are outperforming others. In some EMH models, the return to trading isn’t zero, but instead is just high enough to compensate traders for their time. In this case, people who find markets interesting have a comparative advantage in trading.
Outperforming Through New Information: All but the strongest version of the EMH suggests that those with “private information” can outperform the market. Reading about the very top hedge funds I think they really are good rather than lucky, and the reason is that they have information that others don’t. Sometimes this is better models but often it is simply better data; Jim Simons got historical data on markets at a frequency that no one else had, and analyzed it with supercomputers no one else had. That’s a genuine information advantage, and I don’t think it’s a coincidence that he wound up with tens of billions of dollars. This should be incredibly encouraging to academics. We can’t all be Jim Simons (who was a math professor and codebreaker before starting Renaissance Technologies; Ed Thorpe was another math prof who got rich in markets), but discovering and creating private information is exactly what we do all day as researchers. My hard drive and my head are full of “private information” that others can’t trade on; of course right now most of it is about things like “how certificate of need laws affect self-employment” that have no obvious connection to asset prices, and there is a lot more competition from people trying to figure out markets than from people trying to figure out health economics. But discovering new information that no one else knows is not only possible, it is almost routine for academics, and its not crazy to think this can lead to outperforming the market.
Overall I think economists have gone a bit too far talking themselves and others out of the idea that they could possibly beat the market. I’ll discuss some more specific ideas in the next few weeks, but for now I leave you with 3 big ideas: you can’t win if you don’t try; winning is in fact possible; and if you are smart about it (avoid leverage, options, concentration) then defeat is not that costly.
Disclaimer: This is not investment advice.I say this both as a legal CYA, and because I don’t (yet?) have the track record to back up my big talk
I just found out I’ll be receiving a Course Buyout Grant from the Institute for Humane Studies. It will allow me to teach less next year in order to focus on my research on how Certificate of Need laws affect health care workers.
I’m happy about this because I think this research is valuable and time is my main constraint on doing it (especially doing it quickly enough to inform ongoing policy debates in several states). But I’m also happy because I finally got what I consider to be a “true” grant after many rejections.
I’ve received research funding many times before (e.g. Center for Open Science funding for replications), but it was always relatively small amounts that went directly to me. True grants tend to be larger and to be paid directly to the university. That’s the case with the course buyout grant, which essentially pays the university enough that they can hire someone else to teach my class.
I may have lost count but I’m pretty sure this was the 13th “true grant” I have applied for, and the 1st I will actually receive. Academics have to get used to rejection, since we need to publish and decent journals tend to reject 80%+ of the articles they receive. But for some reason I’ve found grants much harder even than that. From some combination of skill, luck, and targeting lower-tier journals than perhaps I could/should, my acceptance rate for journal articles is probably nearing 50%. I expected this to translate over to grants but it absolutely did not, they seem to be a much different ballgame, one I’m still figuring out.
I’d like to share some of those past misses, both to let junior people see the bumpy road behind success (like a CV of failures), and to try to extract lessons from an admittedly small sample. These proposals were not funded, and probably weren’t even close:
Peterson Foundation US 2050
MacArthur Foundation 100 & Change
RI INBRE (2x)
National Institute for Health Care Management (1x, waiting to hear but probably about to be 2x)
What did these failures of mine all have in common? Me, of course. This is not just a truism; in most of these cases I was applying for major grants solo as an assistant professor without previous funding. The usual advice is to work your way up with smaller grants or, preferably, as the collaborator of a senior professor with lots of previous funding who knows how things work. I knew that would be smart but I’ve tended to be at institutions without senior people in similar fields; almost all my research has either been solo or coauthored with students or assistant professors. Even my PhD advisor was a brand-new assistant professor when we started working together. I had good reasons for ignoring the usual advice to work with well-known seniors, and it has mostly served me well, but grants seem to be the exception.
Twice, I think I did come close on grant proposals, and both times it involved help from seniors at other institutions who had lots of previous funding. At one foundation that funds a lot of social science, my senior coauthor and I got glowing external reviews, but the internal committee rejected us on the grounds that we could do the project without their funding. They were right in the sense that we did do project anyway with no funding; it got published and even won a best paper award. But with their funding we would have done it faster and better and they would have gotten credit for it.
I do think it is smart for funders to consider whether the research would happen anyway without them, or whether their funding really improves things. But I think it is rare for funders to actually do this, and taking this rejection as advice probably led me to more rejections. I tried to propose bigger, more ambitious projects that needed expensive data so it was clear that I really needed the funding; but for most funders this probably made things worse. I have since heard several times that people who get lots of funding from major funders like NIH tend to submit proposals for research they have essentially already finished; that is why their proposals can look so thorough, credible, and polished. They then use the funding to work on their next project (and next proposal) instead of what they said it was for. That seems sketchy to me, but it’s certainly ethical to turn the proposal dial back somewhat toward “obviously achievable for me” from “ambitious and expensive”, and that’s what I’ve done more recently.
The other time I came close was with an R03 proposal to the Agency for Healthcare Research and Quality. First I got a not-close rejection, as I mentioned in the big list, where my proposal was “not discussed”. But AHRQ allows resubmission. At the prompting of my (excellent) grants office, I got feedback on the proposal from two kind seniors at other schools who get lots of funding. I rewrote the proposal based on their comments plus the rejection comments (which were actually quite detailed despite it being “not discussed”) and resubmitted it. This went way better- the resubmission got discussed with an impact score of 30 and a percentile of 17. Lower scores are better for AHRQ/NIH so this was pretty good, good enough that it might have been funded in a normal year, but 2019 was a bad year for government funding (though through some weird quirk I never actually got rejected; 4 years later their system still says “pending council review”). Again, the key to getting close was getting detailed feedback from people who know what they are talking about.
Of course, it also helps to get to know people at the funders and to become more senior yourself. It’s not surprising that my first major grant is coming from IHS given that I’ve been involved with them in all sorts of ways since going to a Liberty & Society seminar way back in 2009. Most funding goes to more senior people who have more connections, knowledge, and proven experience. This is extreme at perhaps the largest funder of research, the National Institutes of Health, where less than 2% of funded principal researchers are under age 36.
This may be the real secret for winning grants- just get older. My 12 rejections all came when I was younger than 36, while my first acceptance came less than a month after my 36th birthday.
In all seriousness, thanks to the Institute for Humane Studies, and I hope that a year from now I’ll be writing here about the great work that came out of this. For everyone with a growing pile of rejections, maybe the 13th time will be the charm for you too.
That is the conclusion of a recent Philadelphia Fed working paper by Ronel Elul, Aaron Payne, and Sebastian Tilson. The fraud is that investors are buying properties to flip or rent out, but claim they are buying them to live there in order to get cheaper mortgages:
We identify occupancy fraud — borrowers who misrepresent their occupancy status as owner-occupants rather than investors — in residential mortgage originations. Unlike previous work, we show that fraud was prevalent in originations not just during the housing bubble, but also persists through more recent times. We also demonstrate that fraud is broad-based and appears in government-sponsored enterprise and bank portfolio loans, not just in private securitization; these fraudulent borrowers make up one-third of the effective investor population. Occupancy fraud allows riskier borrowers to obtain credit at lower interest rates.
One third of all investors is a lot of fraud! The flip side of this is that real estate investors are much more prevalent than the official data says:
We argue that the fraudulent purchasers that we identify are very likely to be investors and that accounting for fraud increases the size of the effective investor population by nearly 50 percent.
Many people blame investors for making housing unaffordable for regular people. Economists tend to disagree, and one of our arguments has been to point out that investors are still a small fraction of home buyers. However, official statistics recently showed the investor share over 25% (though dropping fast), and apparently that may still be an understatement. If investors are a problem, there are enough of them to be a big problem.
Of course, there are other reasons economists aren’t so concerned about real estate investors. One is that they can provide the valuable service of renting out homes to people who couldn’t qualify for a mortgage themselves (especially after 2010, when Dodd Frank made it difficult for people without great credit to qualify). Another is that many investors seem to be surprisingly bad at flipping homes for higher prices. The panic over “ibuyers” that would buy houses sight unseen based on algorithms abated when it turned out those those companies lost a ton of money, saw their stock prices plunge, and gave up.
The mortgage fraud paper also provides evidence of investors losing money. In particular, rather than fraudulent investors crowding out the good ones, they are actually more likely to end up defaulting on their purchases:
These fraudulent borrowers perform substantially worse than similar declared investors, defaulting at a 75 percent higher rate.
Still, such widespread fraud is concerning, and I hope lenders (especially the subsidized GSEs) find a way to crack down on it. Based on things I see people bragging about on social media, I’m guessing that tax fraud is also widespread in real estate investing, though I haven’t looked into the literature on it.
This mortgage fraud paper seems like a bombshell to me and I’m surprised it seems to have received no media attention; journalists take note. For everyone else, I suppose you read obscure econ blogs precisely to find out about the things that haven’t yet made the papers.