Inpatient costs were 27% higher (95% CI 0.252, 0.285), but length of stay was 12% shorter (95% CI −0.131, −0.100), in Comprehensive Cancer Centers relative to community hospitals.
In other words, these cutting-edge hospitals that tend to treat complex cases are more expensive, as you would expect; but despite getting tough cases they actually manage a shorter average length of stay. We can’t nail down the mechanism for this but our guess is that they simply provide higher-quality care and make fewer errors, which lets people get well faster.
The NCI Cancer Centers Program was created as part of the National Cancer Act of 1971 and is one of the anchors of the nation’s cancer research effort. Through this program, NCI recognizes centers around the country that meet rigorous standards for transdisciplinary, state-of-the-art research focused on developing new and better approaches to preventing, diagnosing, and treating cancer.
Our paper focuses on New York state because of their excellent data, the New York State Statewide Planning and Research Cooperative System Hospital Inpatient Discharges dataset, which lets us track essentially all hospital patients in the state:
We use data on patient demographics, total treatment costs, and lengths of stay for patients discharged from New York hospitals with cancer-related diagnoses between 2017 and 2019.
You know I’m all about sharing data; you can find our data and code for the paper on my OSF page here.
My coauthor on this paper is Ryan Fodero, who wrote the initial draft of this paper in my Economics Senior Capstone class last Fall. He is deservedly first author- he had the idea, found the data, and wrote the first draft; I just offered comments, cleaned things up for publication, and dealt with the journal. I’ve published with undergraduates several times before but this is the first time I’ve seen one of my undergrads hit anything close to a top field journal. You can find a profile of Ryan here; I suspect it won’t be the last you hear of him.
90 plus per cent of people, they spend all their time on the buy decision and then they figure it out as they go along on when to sell and we say that’s crazy. You need to establish sell criteria, even if it’s just rebalance, even if it’s a trailing stop, whatever it may be on all your public market positions, because otherwise it gets emotional and that creates huge problems.
Last week I explained why I buy individual stocks. This week I’ll share how I think about when to sell individual stocks, as I go through my portfolio and decide what to hold and what to sell. This is the first time I’m doing this exercise, though I should have done it long ago; until now I’ve unfortunately been on the wrong side of the above Meb Faber quote.
I actually think that most people are correct not to put much thought into what to sell, because I still agree with Buffett and most economists that most people should just buy and hold diversified index funds. Thinking about selling too much might lead people to sell everything whenever they get worried, sit in cash, and miss out on years of gains. But the important truth in Faber’s point is that if you are buying stocks or active funds for any reason other than “its a great company/idea that I’d like to hold indefinitely”, it makes sense to put as much thought into when/whether to sell as when/whether to buy.
People buy stocks all the time based on short-term arguments like “this banking crisis is overblown”, or “I think the Fed is about to cut rates”, or “this IPO is going to pop”, or “I think the company will beat earnings expectations this quarter”. These might be good or bad arguments to buy but they are all arguments about why it makes sense to hold a certain stock for weeks or months, not for years or indefinitely.
But people often buy a stock for short-term reasons like these, then hold on to it long term- either out of inertia, or because they grow attached to it, or because it lost money and they want to hold until it “makes it back” (sunk cost fallacy). None of these reasons really make sense; they might work out because buying and holding often does, but at that point you might as well be in index funds. If you’re going to be actively trading based on ideas, it makes sense to sell once you know whether your idea worked or not (e.g., did the company you thought would beat earnings actually do it) to free up capital for the next idea (unless you genuinely have a good new idea about the same stock, or you think it makes sense to hold onto it a full year to hit long-term capital gains tax). Its also always fair to fight status quo bias and ask “would I buy this today if I didn’t already own it?” (especially if its in a non-taxable account).
Maybe this is obvious to you all, and writing it out it sounds obvious to me, but until now I haven’t actually done this. For instance, I bought Coinbase stock at their IPO because I thought it would trade up given the then-ongoing crypto / meme stock mania. I was correct in that the $250 IPO started trading over $300 immediately; but then I just held on for years while it fell, fell, fell to below $100. The key difference I’m trying to get at here is the one between ideas and execution: its not that I thought Coinbase had such good fundamentals that it was a good long term buy at $250 and my idea was wrong; instead I had a correct short-term idea of what would happen after the IPO, but incorrectly executed it as if it were a long-term idea (mostly through inertia, not paying attention, and not putting in an immediate limit sell order at a target price after buying).
So if you buy stocks for short- or medium-term reasons, it makes sense to periodically think about which to sell. I’ll show how I I think about this by going through some examples from my own current portfolio below (after the jump because I think the general point above is much more important that my thinking on any specific stock, which by the way is definitely not investment advice):
The conventional wisdom among economists is that large, liquid asset markets like the US stock market are incredibly informationally efficient. The Efficient Market Hypothesis (EMH) means that these markets near-instantly incorporate all publicly available information, making future prices essentially impossible to predict (a random walk with drift). As a result, economists’ investment advice is that you shouldn’t try to beat the market, because its impossible except through luck; instead you should aim to tie the market by owning most all of it via diversified low-fee index funds (e.g. SPY or VT).
This idea usually sounds crazy when people first hear it, but it works surprisingly well. You’d think that at least half of participants would beat the market average each year, but active strategies can generate such high fees that its actually much less than that. Further, people who beat the market one year aren’t more likely than average to beat it the next, suggesting that their winning year was luck rather than skill. Even Warren Buffet, who economists will sometimes concede is an exception to this rule, thinks that it is best for the vast majority of people to behave as if the EMH is true:
In 2008, Warren Buffett issued a challenge to the hedge fund industry, which in his view charged exorbitant fees that the funds’ performances couldn’t justify. Protégé Partners LLC accepted, and the two parties placed a million-dollar bet.
Buffett has won the bet, Ted Seides wrote in a Bloomberg op-ed in May. The Protégé co-founder, who left in the fund in 2015, conceded defeat ahead of the contest’s scheduled wrap-up on December 31, 2017, writing, “for all intents and purposes, the game is over. I lost.”
Buffett’s ultimately successful contention was that, including fees, costs and expenses, an S&P 500 index fund would outperform a hand-picked portfolio of hedge funds over 10 years. The bet pit two basic investing philosophies against each other: passive and active investing.
This has been the approach I’ve taken for most of my life, but over the last 3 years I’ve gone from ~99% believing in efficient markets to perhaps ~80%. Missing on crypto felt forgivable, since it was so new and unusual; I recognized that in the early days of a small, illiquid market the EMH might not apply, I just misjudged what counted as “early days” (I figured that by 2011 “everyone” knew about it because Bitcoin had been discussed on Econtalk; its up ~1000x since).
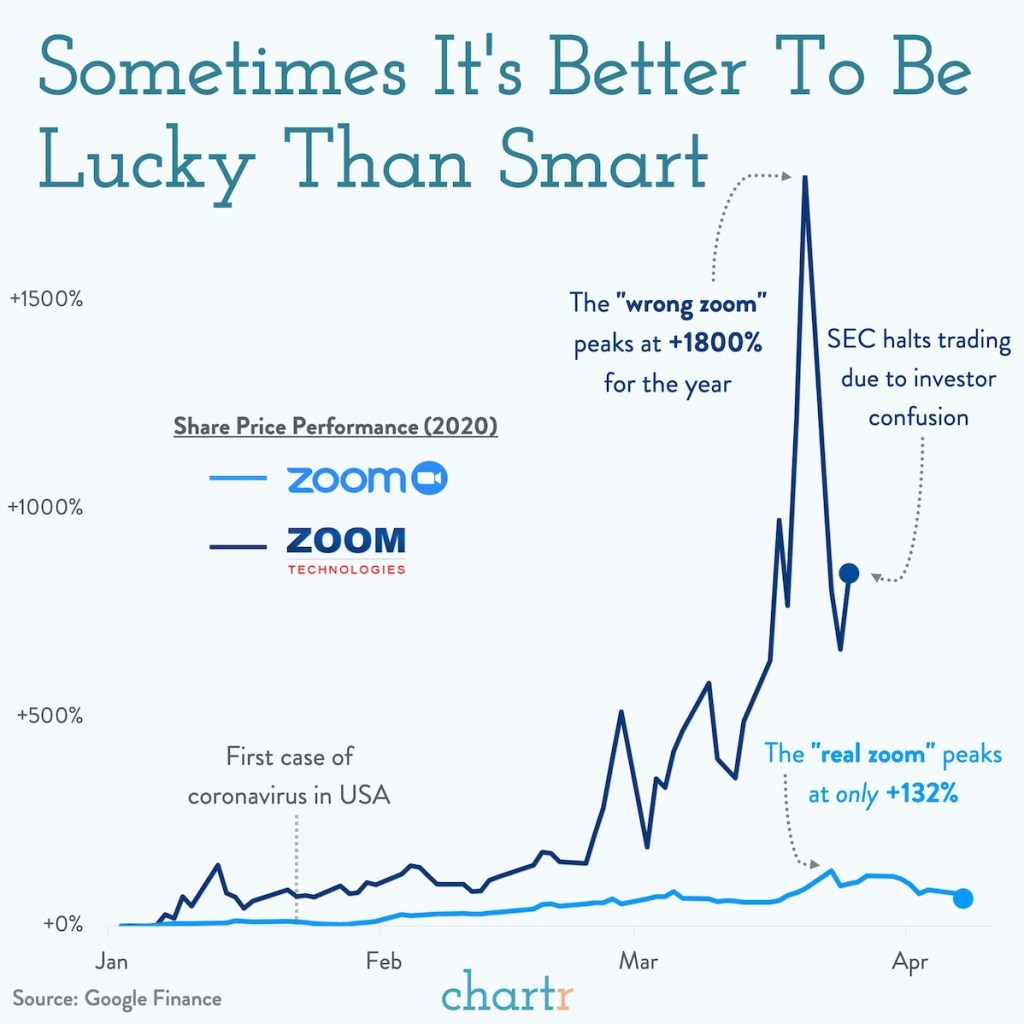
But with the Covid era the anomalies just kept piling up. All through February 2020, the smart people on Twitter were increasingly convincing me that this would be a huge pandemic; the main thing reassuring me was that stocks were up. But by late February they finally started crashing; instead of trusting the markets, I apparently should have trusted my own judgement and bought puts. Then investors starting buying the “wrong” Zoom instead of the one whose business benefitted from Covid:
Then we saw “meme stock mania” with many stocks spiking for reasons clearly unconnected with their fundamental value. Many at Wall Street Bets were clear that they were buying not because of business fundamentals, or even because they thought the price would go up, but because they liked the company, or wanted to be part of a movement, or wanted to send a message, or “own the shorts”.
Anecdotes got me to start taking some of the anti-EMH economics literature more seriously. For instance, Robert Shiller’s work showing that while it might be near-impossible to predict what a single stock will do tomorrow better than chance, predicting what the overall market will do over the longer run is often possible.
By revealed preference, is still mostly buy the EMH. About 80% of my net worth (not counting my home) is in diversified low-fee index funds. But that means 20% isn’t; its in individual stocks or actively traded ETFs with more-than-minimal fees. Why do this? I see 4 reasons buying individual stocks isn’t crazy:
Free trading: Buying a bunch of individual stocks used to incur huge fees. Now, many brokerages offer free trading. Even if the EMH is true, buying a bunch of individual stocks won’t lose me money on average, just time.
Still diversified: Buying into active funds instead of passive ones does tend to mean higher fees, and that is a real concern, but they do still tend to be quite diversified. Even buying individual stocks can leave you plenty diversified if you buy enough of them. Right now I hold about 45, with none representing more than 0.5% of my portfolio; one of them going bankrupt causes no problems. If anything I’m starting to feel over-diversified, and that I should concentrate more on my highest-conviction bets.
Learning: Given the above, even if the EMH is 100% true, my monetary losses due to fees and under-diversification will be tiny. The more significant cost is to my time- time spent paying attention to markets and trading. This is a real cost, enough that I think anyone who finds this stuff boring or unpleasant really should take the conventional econ advice of putting their money in a diversified low-fee index fund and forgetting about it. But I’m starting to find financial markets interesting, and I think keeping up with markets is a great way to learn about the real economy- they always suggest questions about why some companies, sectors, factors, or countries are outperforming others. In some EMH models, the return to trading isn’t zero, but instead is just high enough to compensate traders for their time. In this case, people who find markets interesting have a comparative advantage in trading.
Outperforming Through New Information: All but the strongest version of the EMH suggests that those with “private information” can outperform the market. Reading about the very top hedge funds I think they really are good rather than lucky, and the reason is that they have information that others don’t. Sometimes this is better models but often it is simply better data; Jim Simons got historical data on markets at a frequency that no one else had, and analyzed it with supercomputers no one else had. That’s a genuine information advantage, and I don’t think it’s a coincidence that he wound up with tens of billions of dollars. This should be incredibly encouraging to academics. We can’t all be Jim Simons (who was a math professor and codebreaker before starting Renaissance Technologies; Ed Thorpe was another math prof who got rich in markets), but discovering and creating private information is exactly what we do all day as researchers. My hard drive and my head are full of “private information” that others can’t trade on; of course right now most of it is about things like “how certificate of need laws affect self-employment” that have no obvious connection to asset prices, and there is a lot more competition from people trying to figure out markets than from people trying to figure out health economics. But discovering new information that no one else knows is not only possible, it is almost routine for academics, and its not crazy to think this can lead to outperforming the market.
Overall I think economists have gone a bit too far talking themselves and others out of the idea that they could possibly beat the market. I’ll discuss some more specific ideas in the next few weeks, but for now I leave you with 3 big ideas: you can’t win if you don’t try; winning is in fact possible; and if you are smart about it (avoid leverage, options, concentration) then defeat is not that costly.
Disclaimer: This is not investment advice.I say this both as a legal CYA, and because I don’t (yet?) have the track record to back up my big talk
I just found out I’ll be receiving a Course Buyout Grant from the Institute for Humane Studies. It will allow me to teach less next year in order to focus on my research on how Certificate of Need laws affect health care workers.
I’m happy about this because I think this research is valuable and time is my main constraint on doing it (especially doing it quickly enough to inform ongoing policy debates in several states). But I’m also happy because I finally got what I consider to be a “true” grant after many rejections.
I’ve received research funding many times before (e.g. Center for Open Science funding for replications), but it was always relatively small amounts that went directly to me. True grants tend to be larger and to be paid directly to the university. That’s the case with the course buyout grant, which essentially pays the university enough that they can hire someone else to teach my class.
I may have lost count but I’m pretty sure this was the 13th “true grant” I have applied for, and the 1st I will actually receive. Academics have to get used to rejection, since we need to publish and decent journals tend to reject 80%+ of the articles they receive. But for some reason I’ve found grants much harder even than that. From some combination of skill, luck, and targeting lower-tier journals than perhaps I could/should, my acceptance rate for journal articles is probably nearing 50%. I expected this to translate over to grants but it absolutely did not, they seem to be a much different ballgame, one I’m still figuring out.
I’d like to share some of those past misses, both to let junior people see the bumpy road behind success (like a CV of failures), and to try to extract lessons from an admittedly small sample. These proposals were not funded, and probably weren’t even close:
Peterson Foundation US 2050
MacArthur Foundation 100 & Change
RI INBRE (2x)
National Institute for Health Care Management (1x, waiting to hear but probably about to be 2x)
What did these failures of mine all have in common? Me, of course. This is not just a truism; in most of these cases I was applying for major grants solo as an assistant professor without previous funding. The usual advice is to work your way up with smaller grants or, preferably, as the collaborator of a senior professor with lots of previous funding who knows how things work. I knew that would be smart but I’ve tended to be at institutions without senior people in similar fields; almost all my research has either been solo or coauthored with students or assistant professors. Even my PhD advisor was a brand-new assistant professor when we started working together. I had good reasons for ignoring the usual advice to work with well-known seniors, and it has mostly served me well, but grants seem to be the exception.
Twice, I think I did come close on grant proposals, and both times it involved help from seniors at other institutions who had lots of previous funding. At one foundation that funds a lot of social science, my senior coauthor and I got glowing external reviews, but the internal committee rejected us on the grounds that we could do the project without their funding. They were right in the sense that we did do project anyway with no funding; it got published and even won a best paper award. But with their funding we would have done it faster and better and they would have gotten credit for it.
I do think it is smart for funders to consider whether the research would happen anyway without them, or whether their funding really improves things. But I think it is rare for funders to actually do this, and taking this rejection as advice probably led me to more rejections. I tried to propose bigger, more ambitious projects that needed expensive data so it was clear that I really needed the funding; but for most funders this probably made things worse. I have since heard several times that people who get lots of funding from major funders like NIH tend to submit proposals for research they have essentially already finished; that is why their proposals can look so thorough, credible, and polished. They then use the funding to work on their next project (and next proposal) instead of what they said it was for. That seems sketchy to me, but it’s certainly ethical to turn the proposal dial back somewhat toward “obviously achievable for me” from “ambitious and expensive”, and that’s what I’ve done more recently.
The other time I came close was with an R03 proposal to the Agency for Healthcare Research and Quality. First I got a not-close rejection, as I mentioned in the big list, where my proposal was “not discussed”. But AHRQ allows resubmission. At the prompting of my (excellent) grants office, I got feedback on the proposal from two kind seniors at other schools who get lots of funding. I rewrote the proposal based on their comments plus the rejection comments (which were actually quite detailed despite it being “not discussed”) and resubmitted it. This went way better- the resubmission got discussed with an impact score of 30 and a percentile of 17. Lower scores are better for AHRQ/NIH so this was pretty good, good enough that it might have been funded in a normal year, but 2019 was a bad year for government funding (though through some weird quirk I never actually got rejected; 4 years later their system still says “pending council review”). Again, the key to getting close was getting detailed feedback from people who know what they are talking about.
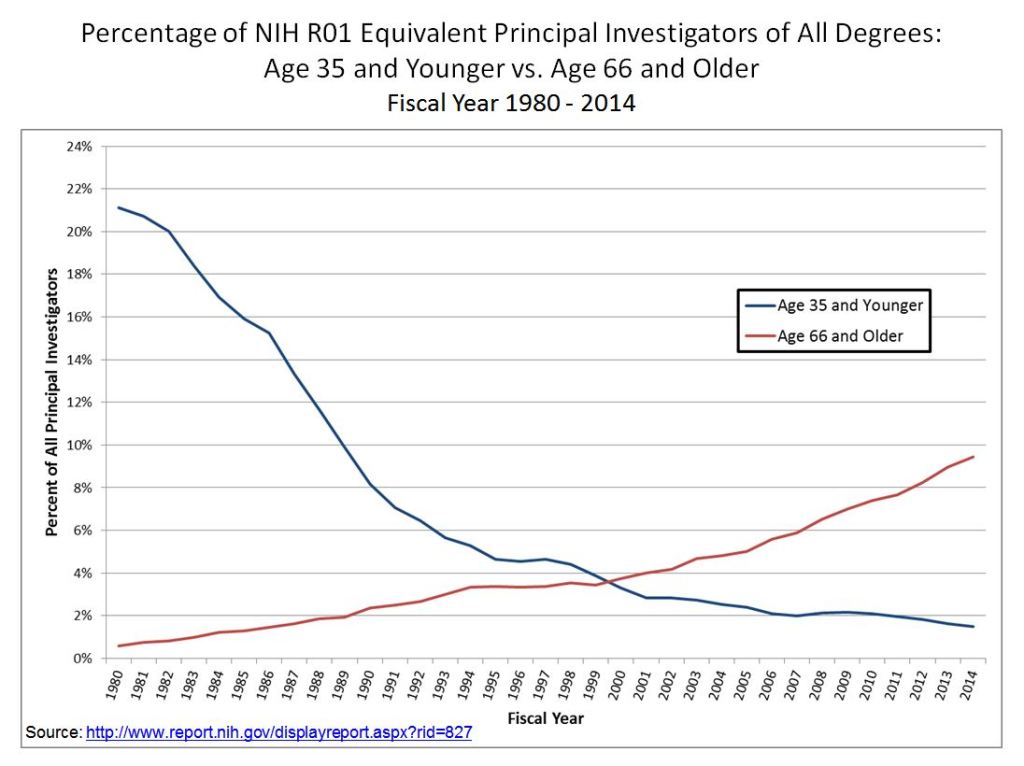
Of course, it also helps to get to know people at the funders and to become more senior yourself. It’s not surprising that my first major grant is coming from IHS given that I’ve been involved with them in all sorts of ways since going to a Liberty & Society seminar way back in 2009. Most funding goes to more senior people who have more connections, knowledge, and proven experience. This is extreme at perhaps the largest funder of research, the National Institutes of Health, where less than 2% of funded principal researchers are under age 36.
This may be the real secret for winning grants- just get older. My 12 rejections all came when I was younger than 36, while my first acceptance came less than a month after my 36th birthday.
In all seriousness, thanks to the Institute for Humane Studies, and I hope that a year from now I’ll be writing here about the great work that came out of this. For everyone with a growing pile of rejections, maybe the 13th time will be the charm for you too.
That is the conclusion of a recent Philadelphia Fed working paper by Ronel Elul, Aaron Payne, and Sebastian Tilson. The fraud is that investors are buying properties to flip or rent out, but claim they are buying them to live there in order to get cheaper mortgages:
We identify occupancy fraud — borrowers who misrepresent their occupancy status as owner-occupants rather than investors — in residential mortgage originations. Unlike previous work, we show that fraud was prevalent in originations not just during the housing bubble, but also persists through more recent times. We also demonstrate that fraud is broad-based and appears in government-sponsored enterprise and bank portfolio loans, not just in private securitization; these fraudulent borrowers make up one-third of the effective investor population. Occupancy fraud allows riskier borrowers to obtain credit at lower interest rates.
One third of all investors is a lot of fraud! The flip side of this is that real estate investors are much more prevalent than the official data says:
We argue that the fraudulent purchasers that we identify are very likely to be investors and that accounting for fraud increases the size of the effective investor population by nearly 50 percent.
Many people blame investors for making housing unaffordable for regular people. Economists tend to disagree, and one of our arguments has been to point out that investors are still a small fraction of home buyers. However, official statistics recently showed the investor share over 25% (though dropping fast), and apparently that may still be an understatement. If investors are a problem, there are enough of them to be a big problem.
Of course, there are other reasons economists aren’t so concerned about real estate investors. One is that they can provide the valuable service of renting out homes to people who couldn’t qualify for a mortgage themselves (especially after 2010, when Dodd Frank made it difficult for people without great credit to qualify). Another is that many investors seem to be surprisingly bad at flipping homes for higher prices. The panic over “ibuyers” that would buy houses sight unseen based on algorithms abated when it turned out those those companies lost a ton of money, saw their stock prices plunge, and gave up.
The mortgage fraud paper also provides evidence of investors losing money. In particular, rather than fraudulent investors crowding out the good ones, they are actually more likely to end up defaulting on their purchases:
These fraudulent borrowers perform substantially worse than similar declared investors, defaulting at a 75 percent higher rate.
Still, such widespread fraud is concerning, and I hope lenders (especially the subsidized GSEs) find a way to crack down on it. Based on things I see people bragging about on social media, I’m guessing that tax fraud is also widespread in real estate investing, though I haven’t looked into the literature on it.
This mortgage fraud paper seems like a bombshell to me and I’m surprised it seems to have received no media attention; journalists take note. For everyone else, I suppose you read obscure econ blogs precisely to find out about the things that haven’t yet made the papers.
Li Yining, Chinese reformer, helped re-establish the Chinese stock market
Padma Desai, Indian reformer and scholar of planning
Rebecca Blank, labor economist, UW chancellor, acting US Secretary of Commerce
Harry Markowitz, won Nobel for “pioneering work in the theory of financial economics” (finding the risk-return optimal frontier for a portfolio)
Not all the biggest names, but all important enough that I knew of them despite not working in their subfields and, unfortunately, not having met them personally.
Let me know if I’m currently missing anyone, though let’s hope the list doesn’t get much longer by the end of 2023.
If a scientific finding is really true and important, we should be able to reproduce it- different researchers can investigate and confirm it, rather than just taking one researcher at their word.
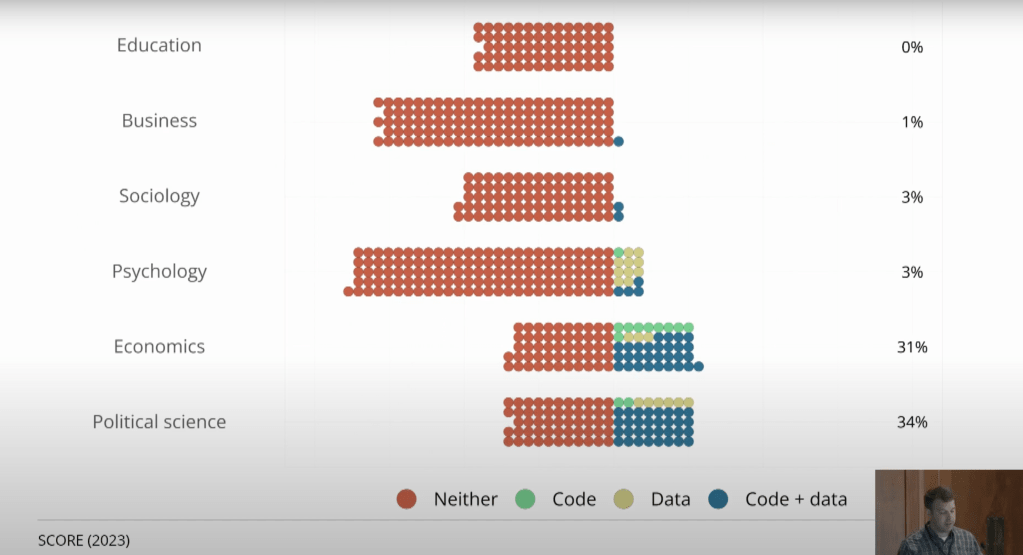
Economics has not traditionally been very good at this, but we’re moving in the right direction. It is becoming increasingly common for researchers to voluntarily post their data and code, as well as for journals (like the AEA journals) to require them to:
This has certainly been the trend with my own research; if you look at my first 10 papers (all published prior to 2018) I don’t currently share data for any of them, though I hope to go back and add it some day. But of my most recent 10 empirical papers, half share data.
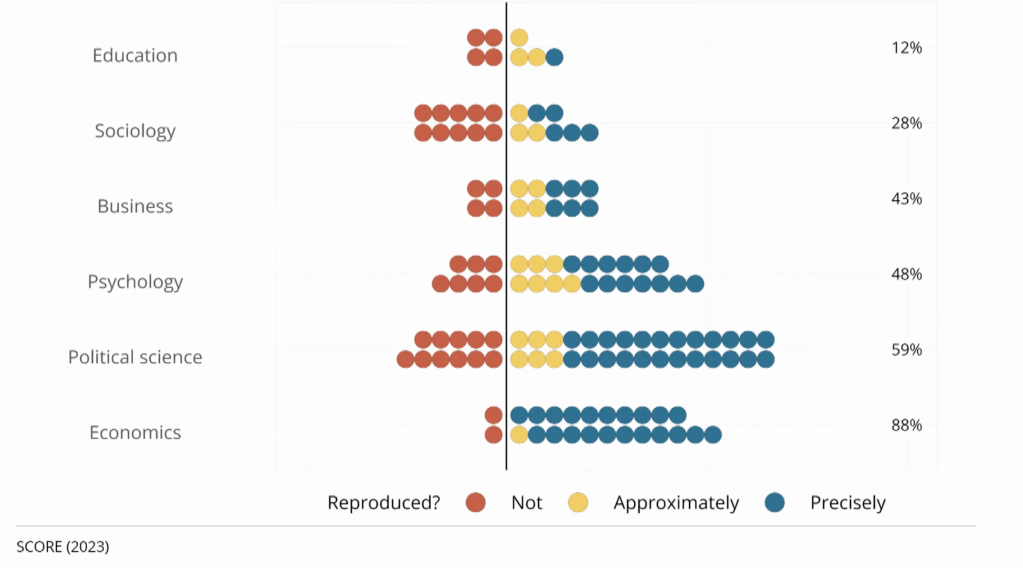
This sharing allows other researchers to easily go back and check that the work is accurate. This could mean simply checking that it is “reproducable”, i.e., that running the original code on the original data produces the results that the authors said. Or it could mean the more ambitious “replicability”, i.e., you could tackle the same question with different data and still find basically the same answer. Economics does generally does well at reproducability when code is shared, but just ok at replication.
Of course, even when data and code are shared, you still need people to actually do the double-checking research; this is still relatively rare because it is harder to publish replications than original research. But more replication journals are opening, and there are now several projects funding replications. The trends are all in the right direction to establish real, robust findings, with one exception- the rise of restricted data.
Traditionally most economics research has been done using publicly available datasets like the Current Population Survey. But an increasing proportion, perhaps a majority of research at top journals, is now done using restricted datasets (there’s a great graph on this I can’t find but see section 3.3 here). These datasets legally can’t be shared publicly, either due to privacy concerns,licensing agreements, or both. But journals almost always still publish these articles and give them an exemption to the data sharing requirement. One the one hand it makes sense not to ignore this potentially valuable research when there are solid legal reasons the data can’t be shared. But it does mean we can’t be as confident that the data has been analyzed correctly, or that it even really exists.
One potential solution is to find people who have access to the same restricted dataset and have them do a replication study. This is what the Institute for Replication just started doing. They posted a list of 100+ papers that use restricted data that they would like to replicate. They are offering $5000 for replications of most of the papers, so I think it is worthwhile for academics to look and see if you already have access to relevant datasets, or if you study similar enough things that it is worth jumping through the hoops to get data access.
For everyone else, this is just one more reason not put too much trust in any one paper you read now, but to recognize that the field as a whole is getting better and more trustworthy over time. We will be more likely to catch the mistakes, purge the frauds, and put forward more robust results that at least bear a passing resemblance to what science can and should be.
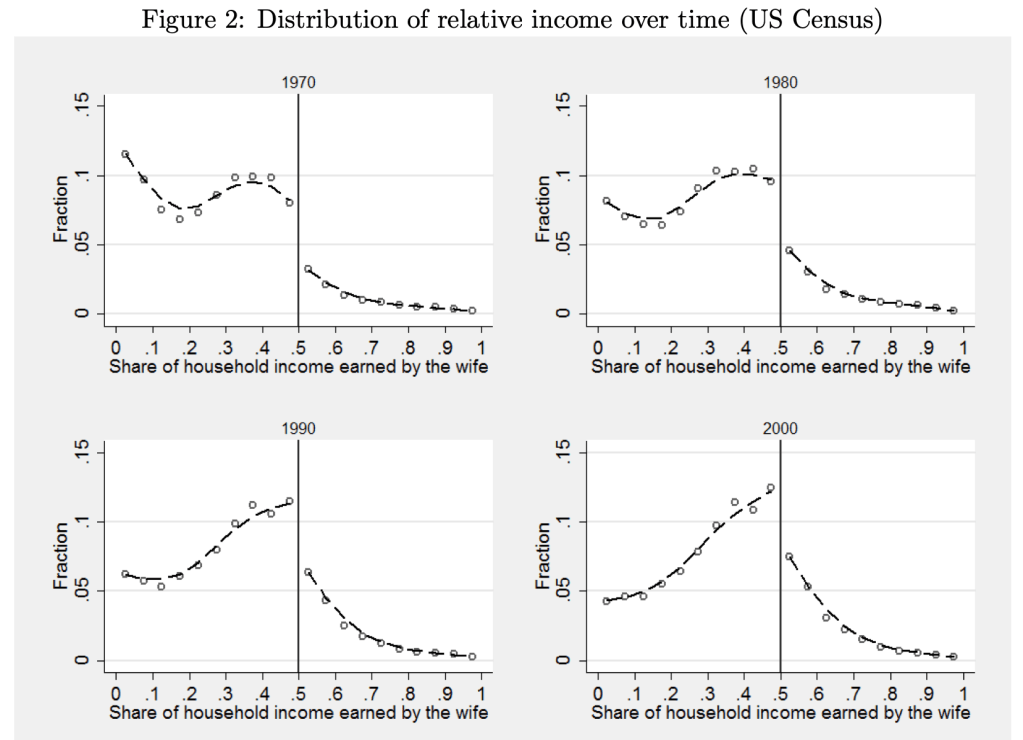
As we have gone through our education and training and changed jobs, my wife and I have been in every sort of relative income situation, with each one sometimes vastly or slightly out-earning the other. Currently she slightly out-earns me, which I thought was unusual, as I remembered this graph from Bertrand, Kamenica and Pan in the QJE 2015:
The paper argues that the big jump down at 50% is driven by gender norms:
this pattern is best explained by gender identity norms, which induce an aversion to a situation where the wife earns more than her husband. We present evidence that this aversion also impacts marriage formation, the wife’s labor force participation, the wife’s income conditional on working, marriage satisfaction, likelihood of divorce, and the division of home production. Within marriage markets, when a randomly chosen woman becomes more likely to earn more than a randomly chosen man, marriage rates decline. In couples where the wife’s potential income is likely to exceed the husband’s, the wife is less likely to be in the labor force and earns less than her potential if she does work. In couples where the wife earns more than the husband, the wife spends more time on household chores; moreover, those couples are less satisfied with their marriage and are more likely to divorce.
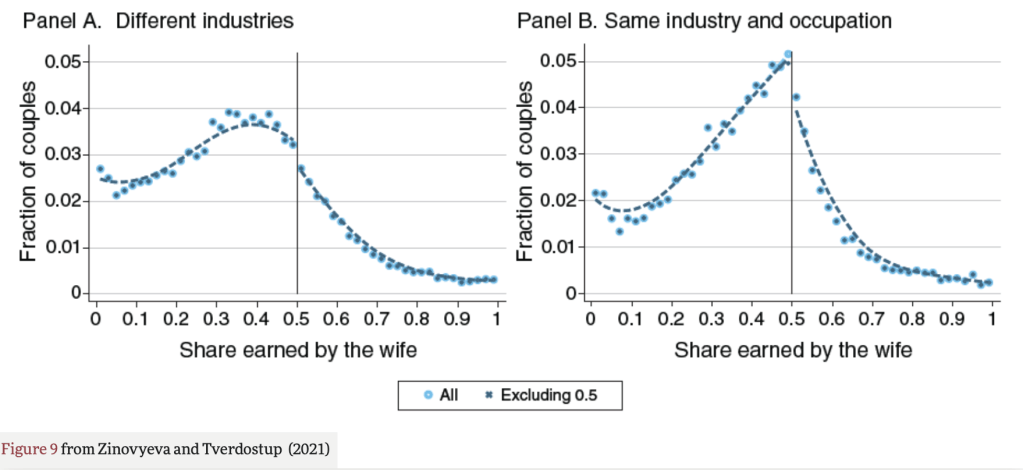
But when I went to look up the paper to show my wife the figures, I found that the effect it highlights may no longer be so large. Natalia Zinovyeva and Maryna Tverdostup show in their 2021 AEJ paper that the jump down in wives’ income at 50% is quite small, and is largely driven by couples who have the same industry and occupation:
They created the figure above using SIPP/SSA/IRS Completed Gold Standard Files, 1990–2004. I’d be interested in an analysis with more recent data. Much of their paper uses more detailed Finnish data to test the mechanism for the remaining jump down at 50%. They conclude that gender norms are not a major driver of the discontinuity:
We argue that the discontinuity to the right of 0.5 can emerge if some couples tend toward earnings equalization or convergence. To test this hypothesis, we exploit the rich employer-employee–linked data from Finland. We find overwhelming support in favor of the idea that the discontinuity is caused by earnings equalization in self-employed couples and earnings convergence among spouses working together. We show that the discontinuity is not generated by selective couple formation or separation and it arises only among self-employed and coworking couples, who account for 15 percent of the population.
Self-employed couples are responsible for most observations with spouses reporting identical earnings. When couples start being self-employed, both sides of the distribution tend to equalize earnings, perhaps because earnings equalization helps couples to reduce income tax payments, facilitate accounting, or avoid unnecessary within-family negotiations. Large spikes emerge not only at 0.5 but also at other round shares signaling the prevalence of ad hoc rules for entrepreneurial income sharing in couples. Self-employment is associated with a fall of household earnings below the level predicted by individuals’ predetermined characteristics, but this drop is mainly due to a decrease in male earnings, with women being relatively better off.
In the case of couples who work together in the same firm, there is a compression of the earnings distribution toward 0.5 both on the right and on the left of 0.5. As a result, there is an increase both in the share of couples where men slightly outearn their wives and in the share of couples where women slightly outearn their husbands. Since the former group is larger, earnings compression leads to a detection of a discontinuity.
So, concerns about relative earnings aren’t causing trouble for women in the labor market. But do they cause trouble at home? Perhaps yes, but if so its not in a gendered way and not driven by the 50% threshold:
Separation rates do not exhibit any discontinuity around the 0.5 threshold of relative earnings. Instead, the relationship between the probability of separation and the relative earnings distribution exhibits a U-shape, with higher separation rates among couples with large earnings differentials either in favor of the husband or in favor of the wife.
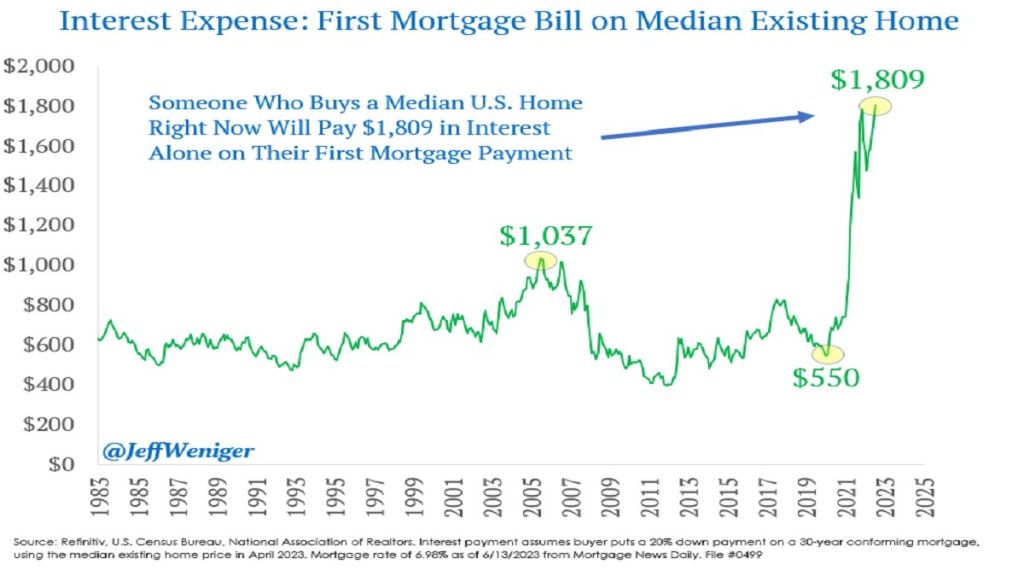
The Federal Reserve has been increasing interest rates at the fastest pace since the 1980’s, from near-zero rates in March of last year to over 5% today. This has led to rapid slowdowns in interest-rate sensitive sectors like housing, cars, and startups. Because most people finance their home buying, higher interest rates mean higher monthly payments for a house at a given price. Since many people were already buying houses near the highest monthly payment banks would allow them to, higher interest rates mean they need to buy cheaper houses or just stay out of the market and rent. This is especially true as the interest expense on mortgages has tripled in two years:
You’d think this would be bad news for homebuilders, and for most of 2022 markets agreed: homebuilder stocks fell 36% from the beginning of 2022 to September 2022 after the Fed started raising rates in March. But homebuilder stocks have recovered since September, with some major names like D.R. Horton and Lennar hitting all time highs. Why?
I bought homebuilder stocks in January but I have to say even I wasn’t expecting such a fast recovery (if I had, I would have bought a lot more). I was buying because they were cheap on a price to earnings basis and temporarily out of fashion; I love stocks that are priced like they’re in a secular decline to bankruptcy when its clear they are actually just having a bad cycle and will recover when it turns. But I thought I’d have to wait years for falling interest rates and a recovering housing market for this to happen. Instead these are up 20-100% in 6 months. Why?
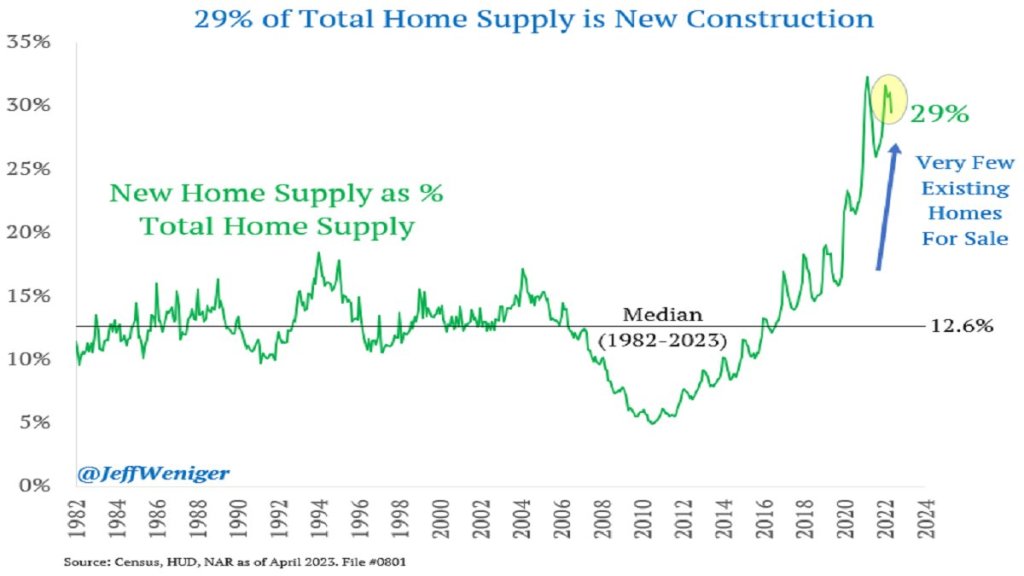
The big thing I missed was that high interest rates have hit their competition harder, reducing supply as well as demand. Who is the competition for homebuilders? Existing homeowners. Homeowners with the “golden handcuffs” of a 3% mortgage who don’t want to move if it means switching to a 7% mortgage. I’m seeing this personally in Rhode Island- I’d kind of like a house with a bigger yard on a quieter street, but there are only 5 houses for sale in my whole school district. Between that and interest rates, we’re staying put. But for people who really need to move, new homes are making up a record proportion of the available inventory:
This situation seems likely to persist for at least months, and possibly years. The Fed paused its rate hikes yesterday for the first time since last March, but indicated that more hikes may lie ahead. I’m tempted to take the win and sell homebuilder stocks, but they still have price to earnings ratios under 10, and the “golden handcuffs” on their competition seem likely to stay on for at least another year.
Getting long-run historical PE ratios of US stocks by industry seems like the kind of thing that should be easy, but is not. At least, I searched for an hour on Google, ChatGPT, and Bing AI to no avail.
I eventually got monthly median PEs for the Fama French 49 industries back to 1970 from a proprietary database. I share two key stats here: the average of median monthly industry PE 1970-2022, and the most recent data point from late 2022.
Industry
Long Run Mean
End 2022
AERO
12.14
19.49
AGRIC
10.75
9.64
AUTOS
9.65
17.52
BANKS
10.38
10.46
BEER
15.23
35.70
BLDMT
12.00
15.41
BOOKS
12.95
17.60
BOXES
12.18
10.69
BUSSV
12.07
13.03
CHEMS
12.40
19.26
CHIPS
10.48
17.47
CLTHS
11.45
10.94
CNSTR
8.98
4.58
COAL
8.04
2.92
DRUGS
1.14
8.01
ELCEQ
10.78
17.85
FABPR
10.28
19.40
FIN
11.16
12.97
FOOD
14.30
25.03
FUN
9.10
21.06
GOLD
3.18
-5.95
GUNS
11.50
5.05
HARDW
7.96
19.16
HLTH
11.91
6.09
HSHLD
12.60
20.15
INSUR
10.95
16.33
LABEQ
13.46
25.18
MACH
12.51
20.27
MEALS
13.83
19.19
MEDEQ
6.81
27.64
MINES
8.06
16.27
OIL
6.96
9.00
OTHER
12.20
27.68
PAPER
12.50
16.69
PERSV
12.86
-0.65
RLEST
8.13
-0.30
RTAIL
12.26
8.58
RUBBR
12.11
12.81
SHIPS
9.79
17.42
SMOKE
11.74
17.79
SODA
12.38
32.09
SOFTW
8.21
-2.85
STEEL
8.18
4.30
TELCM
6.75
9.58
TOYS
9.18
-1.32
TRANS
11.25
13.11
TXTLS
9.43
-49.00
UTIL
12.34
17.41
WHLSL
11.08
13.13
Mean Industry Median
10.52
12.73
One obvious idea for what to do with this is to invest in industries that are well below their historical price, and avoid industries that are above it (not investment advice). Looking just at current PEs is ok, but a stock with a PE of 8 isn’t necessarily a good value if its in an industry that typically has PEs of 6.
By this metric, what looks overvalued? Money-losing industries (negative current earnings): Gold, Personal Services, Real Estate, Software, Toys, and Textiles. Making money but valuations 19+ above historical average: Medical Equipment, Beer, Soda. Most undervalued relative to history: Guns, Health, Coal, Construction, Steel, Retail (all 3+ below the historical average).
Of course, I don’t recommend blindly investing in these “undervalued” industries- not just for legal reasons, but because sometimes the market prices them low for a reason- that earnings are expected to fall. The industry may be in secular decline due to new types of competition (coal, steel, retail). Or investors may expect it to get hit with a big cyclical decline in an upcoming recession or rotation from the Covid goods/manufacturing economy back to services (guns, construction, steel, retail). Health services (as opposed to drugs and medical equipment) stands out here as the sector where I don’t see what is driving it to trade at barely half of its usual PE.
I’d still like to get data on long run market-cap weighted mean PE by industry, as opposed to the medians I show here. The best public page I found is Aswath Damodaran’s data page, which has a wide variety of statistics back to about 1999. Some of the current PEs he calculates are quite different from those in my source, another reason to tread carefully here. I’m not sure how much of this is mean vs median and how much is driven by different classification of which stocks fit in which industry category.
This gets at a big question for anyone trying to actually trade on this- do you buy single stocks, or industry ETFs? Industry ETFs make sense in principle (since we’re talking about industry level PEs overall) and also add built-in diversification. But the PE for the ETF’s basket of stocks likely differs from that of the industry as a whole. It would make more sense to compare the ETF’s current PE to its own historical PE, but most industry ETFs have very short track records (nothing close to the 53 years I show here). PE is also far from the only valuation metric worth considering.
All this gets complex fast but I hope the historical PE ratio by industry makes for a helpful start.