Chickens were apparently domesticated from the red jungle fowl (Gallus gallus), a native of southeast Asia, thousands of years ago. Humans have been selectively breeding them ever since. Traditionally, chickens were valued mainly for their eggs. Surplus roosters would get eaten, of course, and tough overage laying hens would end up in the stewpot. But your typical chicken was a stringy, hardy bird whose job was to stay alive and to lay eggs.
Raising chickens en masse just for eating started in 1923 with Celia Steele of southern Delaware, somewhat by accident. She wanted to set up a small flock of egg-laying chickens to supplement her husband Wilmer’s Coast Guard salary. She placed an order for 50 chicks, but it was mistakenly heard as 500. When she got this huge shipment, she thought fast and decided to raise them to eating size (“broilers”) and then immediately sell them. She built a coop designed for grow-out, rather than for egg-laying. This enterprise was profitable, so she expanded operations. She doubled production the next year, and by 1926 she had 10,000 chickens. Her neighbors saw her success, and also went into the broiler biz. Thus was spawned the modern broiler industry. All this was aided by the general prosperity in the 1920s, together with technical progress in refrigeration and transportation. Her first broiler house is now on the U.S. Registry of Historic Places.
However, chickens themselves were still scrawny by today’s standards. As of 1948, chicken meat was still an expensive luxury. With the broiler (meat chicken) market established, breeders naturally tried to develop strains that would grow big and fast. That not only allows more meat to be grown in a given flock, but fast growth means less feed is consumed to get to market weight.
For several years around 1950, A&P Supermarkets sponsored a “Chicken of Tomorrow” program, overseen by the USDA, to promote improved broiler breeding. As examples of chickendom as of 1948, here are plucked carcasses of contestants for the Chicken of Tomorrow contest of that year. Note how stringy they are, compared to the plump, meaty bird you buy at the grocery store today:
Without going into much detail, the ultimate product was a cross (hybrid) between the Cornish chicken and other breeds. Cornish cross chickens were initially bred for size and growth rate. By say the 1990s, that led to birds that were so heavy that they sometimes could not support their own weight. More recent breeding programs promote leg strength and other health factors, as well as sheer growth.
To produce today’s optimized broiler is a complex process. Breeders must maintain something like four purebred strains, and then carefully cross-breed them, and then cross-breed some more, to get the final hybrid chick to send out for farmers to raise. Only these hybrids have the optimized characteristics; you can’t just take a bunch of these crossed chickens and breed a good flock from them:
Only a few large outfits can afford to do this, so most hatcheries are supplied by a handful of big breeders. However, there seems to be enough competition to keep the prices down for the consumer. Some folks will always find something to complain about (reduced genetic diversity or hardiness, etc.), but they are welcome to breed and grow less efficient chickens, if it pleases them.
In terms of dollars: “The inflation-adjusted cost of producing a pound of live chicken dropped from US$2.32 in 1934 to US$1.08 in 1960. In 2004, the per-pound cost had dropped to 45 cents, according to the USDA Poultry Yearbook (2006).”
According to the National Chicken Council, in 1925 it took a broiler chicken an average of 112 days to reach a market weight of 2.5 pounds. As of 2024, the market weight has soared to 6.5 pounds, and chickens reach that weight much faster, in 47 days (about the time it takes leafy green vegetables). The net result is that now it only takes about 1.7 pounds of feed to grow one pound of chicken, compared to 4.7 lb/lb in 1925. This nearly three-fold reduction in resource consumption translates into lower consumer costs, lower load on the environment and agricultural resources, and even lower CO2 generation. The largest jump feed conversion efficiency (from 4 to 2.5 lb/lb) occurred between 1945 and 1960, thanks to the development of the Cornish cross.
Despite the nearly universal outcry, President Trump was standing firm on his massive tariffs. “No backing down”, etc., despite the evaporation of trillions of dollars in stock values. On Tuesday, April 8, White House spokesperson Karoline Leavitt affirmed: “The President was asked and answered this yesterday. He said he’s not considering an extension or delay. I spoke to him before this briefing. That was not his mindset. He expects that these tariffs are going to go into effect.” However, the next day, Wednesday, April 9, Trump announced on his social media platform, Truth Social, that for all countries but China, there would be a 90-day pause in reciprocal tariffs.
What happened here? The common explanations are that (1) the chaos and losses in the markets had finally grown intolerable, or that (2) the president had planned all along to pause the tariff hikes on April 9. I suspect there is some merit to both of these factors – -despite all the prior warnings, I think (1) Trump did not expect such market devastation (he sincerely believes that he is making the American economy great, so why should markets crash?), and also (2) that he had indeed planned to play around with tariff implementations in pursuit of deals.
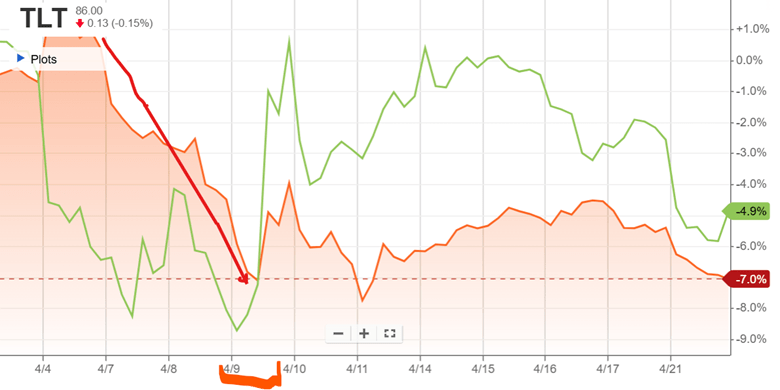
But what some analysts pointed out as a further factor was the drop in the market value of U.S. Treasury bonds, which correlates directly to a rise in interest rates. The actions of the Administration have seemingly caused market participants, especially abroad, to question the risk-free status of U.S. debt. If the government has to pay higher interest on its debt, it is game over, as interest payments will spiral up and consume an ever-higher share of the federal budget. The chart below shows in orange the price movement of the TLT fund, which holds long-term T-bonds, plummeting on April 7, 8, and 9 (red arrow), as an indicator of rising rates. TLT price then shot upwards, along with stocks (the green line is S&P 500 fund SPY) late on April 9, in the relief following the tariff announcement:
As Treasury Secretary, Scott Bessent would be particularly sensitized to the interest rate issue, and able to communicate that to the boss. He has been a successful hedge fund trader and manager, so he understands the plumbing of the system, unlike some other presidential advisors. Up till then, however, economist Peter Navarro, who is ultra-hawkish on tariffs, had had the ear of the president.
So, what did Bessent do? (This is the part that only came to my attention a few days ago, even though technically this is old news). It seems he enlisted the support of Commerce Secretary Lutnick, and adroitly chose a time when Navarro was tied up in a meeting, and barged in on the president in an unscheduled meeting so they could get him alone. And it worked! Evidently, they persuaded him that now was the time to do the clever deal-making thing and issue a pause. It’s a mark of how readily the president can change his mind that his own press spokespeople were unaware of this volte-face, and had to scramble to make sense of it. It is also interesting that cabinet members are resorting to cloak-and-dagger tactics to get policy done.
Bessent naturally gave all the credit to the president for the decision, but he and Lutnick had photos taken to show who saved the financial world – for now:
Scott Bessent (standing, left) and Howard Lutnick (right) with President Trump as he signs 90-day pause in reciprocal tariffs. Source: Daily Mail.
The president’s recent musings about trying to fire the supposedly independent Fed chairman have since contributed to interest rates going back up again, but that is another story.
Here we discuss some stock funds that go down less than stocks in general; the flip-side is that they go up less than plain stocks, as well. Some investors may appreciate the reduction in gyrations, especially after a week like the previous one.
Long-short funds come in two main flavors. When you buy a stock, that is considered being “long”. If you short-sell a stock (borrow shares from some broker, that you plan to pay market price for later, such that you make roughly one dollar for every dollar the stock goes down), that is being short.
“Equity-neutral” funds are short as much value of stocks as they are long. So, they are net 0% long. Obviously, you would expect the value of such a fund to not decline much in a market crash. But conversely, it would not go up much in a bull market, either. So how is this better than just holding cash in your account? The magic is if the active fund managers can manage to be long a set of stocks which go up more than the stocks that they short. They often try to pair longs and shorts in the same sector. For instance, in 2024 if a fund was long Nvidia and short Intel (another stock in the semiconductor sector), that would have been a big net win. Sometimes this works, and sometimes it doesn’t.
The actual performance of such a fund is very dependent on the active managers’ skill and luck. For instance, here is a ten-year total return plot of two market-neutral funds, one from AQR and the other from Vanguard. The Vanguard fund (VMNIX) muddled along pretty flat from 2015 through 2021, then had a slow rise 2021-2023, then went flat again. The performance of the AQR fund (QMNNX) has been more erratic. It went up 2015-2017, then down a lot (this would have been hard to bear at the time, when the S&P was roaring upward) for 2018-2020. It then roughly matched the Vanguard fund for a couple of years, then pulled way ahead 2023-2025, as it made some great long/short choices:
However, the ten-year performance of these funds fell far short of a simple S&P500 holding (blue line above). Since stocks go up the vast majority of the time, a long-short fund which is net long seems to make more sense.
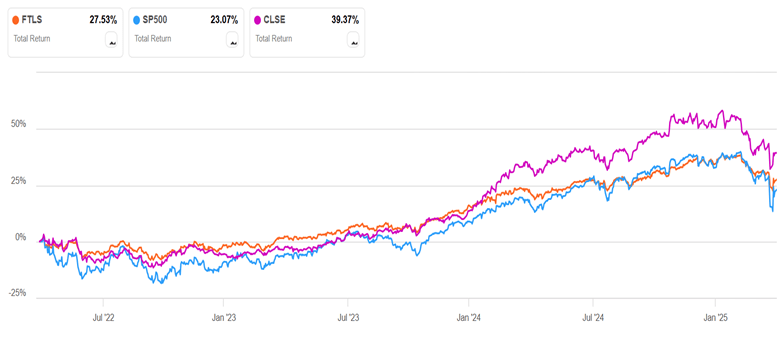
A plain vanilla net-long long-short fund is FTLS. It seems to be among the best of the long-short ETFs. It is usually about 60% net long. I modeled its performance against a portfolio of 60% S&P 500 stocks and 40% cash (rebalanced periodically), and it performed about the same. That is, FTLS went up and down with moves about 60% of what the S&P did. That is OK, but one might wonder why one would hold such a fund instead of just holding a 60/40 stocks/cash allocation for the same amount of investment. If we look at time periods with appreciable down periods, such as the past three years (see chart below), FTLS does look comforting; its muted dips in 2022 and 2025 compensate for its slower rise in 2023-2024, so it presents as a slow, fairly steady rise with a 3-year total return slightly higher than S&P. It is certainly easier psychologically to hold such a fund, and it might help small investors avoid the deadly mistake of panic-selling during a market downturn.
CLSE is a long-short fund that is often about 70% long. Management there takes a more swashbuckling, risk-taking approach. It went down less than S&P in the bear market of 2022 (as expected), and then it soared high above S&P in the first half of 2024, as it made skillful/lucky picks to go very long tech growth stocks like NVDA. That tech-heavy approach has backfired so far in 2025, since CLSE has fallen as much as S&P in the past several months (NOT what one hopes for a long-short fund). Despite that glitch, however, CLSE still weighs in with a 3-year return far ahead of the broader S&P (39% vs. 23%):
Another strategy to mitigate market ups and downs is for a stock fund to buy and sell put and call options, to create a “collar” effect. Buying puts limits the downward movements; the puts are financed by selling calls, which limits the upward swings. The fund ACIO, for instance, seeks to capture 65% of the S&P’s upside, while limiting loss to 50% of the downside. In my stock charting, I found it ended up performing about like FTLS. As of a week ago (Tue, Apr 8), the S&P was down 15% year to date (i.e., since Jan 1), while FTLS and ACIO were only down 8.3 % and 9.6%, respectively.
Standard Disclaimer: This is for information only. Nothing here is advice to buy or sell any security.
Upfront disclaimer: This post is NOT about the most recent salvo of U.S. tariffs – enough apoplectic digital ink is gushing there already. It is about is an underlying question that these tariffs raised in my mind, which is the title of this article.
If there is one thing that nearly all economists, left, right, and center, can agree on, it is that free trade is good (see, for instance, a classic exposition of gains from trade on EcoNomNomNomics) and thus tariffs are bad. The main reason the local producers would need “protection” is because their goods (and services) are more expensive than the imports, and so by definition the consumers will pay more for their stuff. Thus, as is always noted, tariffs are a kind of tax on consumers. And yet…as far as I can tell all or nearly all nations impose tariffs on imported goods. So, what’s up with that?
This is not an area of expertise for me, so I went roaming the web to get some various opinions. The main reason given is to “protect local industry/agriculture”, and by extension, local jobs. We have to drill down deeper to see the reasoning involved.
In some cases, it is a simple, unsavory matter of a local industry having a powerful enough clout either at the business level or the labor level to lobby for special treatment (which costs the rest of the consumers more). But there are other cases where it is argued that it is important for national security to maintain a certain level of domestic production. For instance, historically nations like Japan and Switzerland maintained high tariffs on certain agricultural imports, in order to retain some domestic food production so they would not starve if something happened to interrupt international trade. Ditto for defense-related or other “strategic” production, and so on.
And in many cases, there just seems to be a gut feel that it is more patriotic or economically healthy to promote in-country production. Also, if a certain inefficient industry employs a lot of workers, the medium-term pain of letting that industry fail while resources shift elsewhere may be unacceptable. Economists promise us that the sooner or later those unemployed workers and empty factories will be put to some other, more worthy use, but it can be hard to believe in the “invisible hand” when suddenly you cannot pay your rent and no other jobs are available.
Two other factors came up. One is that for less developed counties without sophisticated internal revenue services, tariffs are a convenient way to collect revenue, and in fact may provide a significant share of government support. If I recall my high school history correctly, the fledgling United States government supported itself largely by tariffs, back in the day.
Another motive is what I would call “smart” tariffs, aimed not at indefinitely protecting inefficient producers, but at promoting improved production. What I have in mind is something I read some years ago, in an article I cannot now lay hands on, describing Korea’s path to industrialization. Protectionism was very much a part of that. The nation’s consumers did forgo short-term cheap consumption, in exchange for the development of domestic production which would in the long-term benefit everyone. I think one example was cigarettes. The government decided that cigarette production was a reasonable place to start industrializing, so they taxed imports to drive the price high enough to justify putting in cigarette-making equipment. After some years, they were happily making cigarettes, employing Koreans and building institutional muscle for the next phases of industrialization.
China has maintained a high degree of protectionism, including capital controls, and has grown and prospered mightily. So, I think that in assessing tariffs, it is essential to look past the immediate effects (which economists can always argue are “bad”, i.e., reduced consumption) to the longer-term impacts. Smart tariffs of the kind that East Asian countries have employed seem to have parlayed short-term consumer pain into long-term societal gains. Non-smart tariffs – -maybe not so much.
While I was in southern Vermont last month, I visited a maple syrup production operation. The actual shed is called a “sugar house”, and the operation is called sugaring, even though the main product is the syrup.
When I was a boy, my dad hung some buckets on taps into the two maple sugar trees in our yard to collect the sap. He boiled the sap in a big old copper tub/kettle set on cinder blocks over a wood fire. You do have to boil and boil, since it takes about 45 gallons of sap to make one gallon of syrup. The other 44 gallons is boiled off by the heat of the burning firewood.
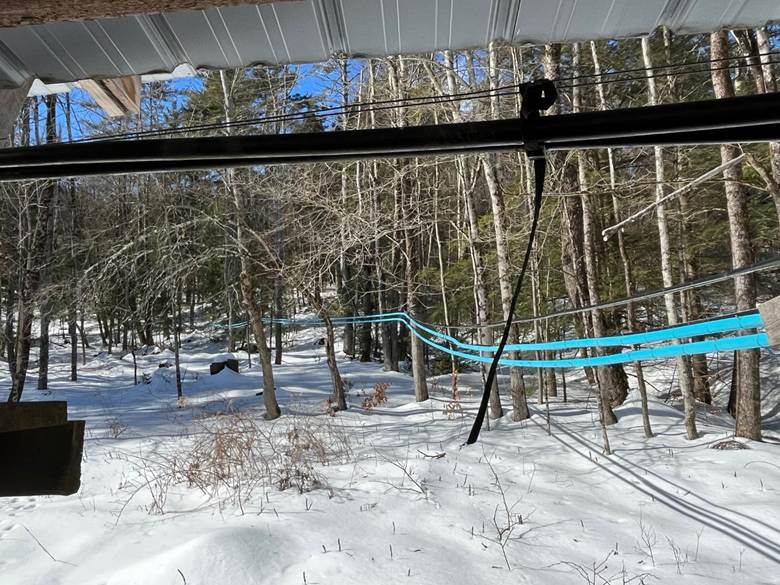
David Franklin’s operation in Guilford, VT (near Brattleboro) is much more efficient than that. The sugar house is set at the base of a long slope. The sap from the taps in the trees goes into tubing that connects into more tubing which goes downhill, so hundreds of trees feed into the long blue tubing shown here, which goes into collection tankage:
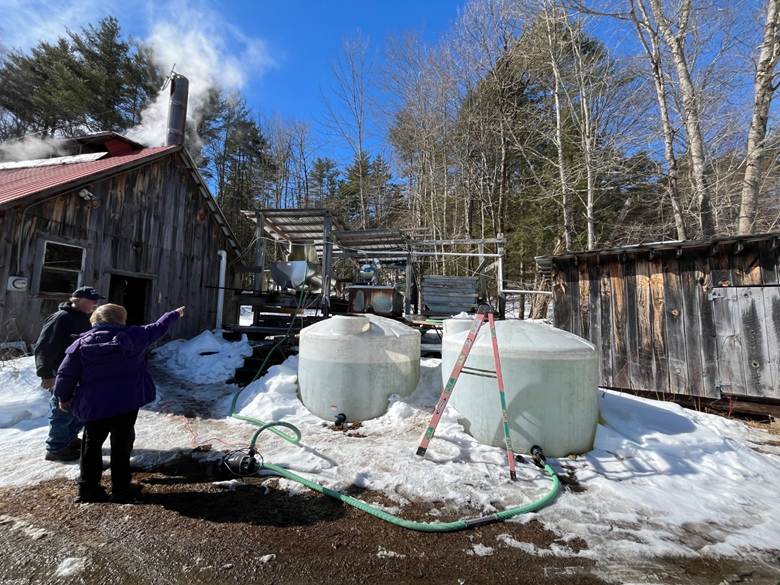
The tanks and pumps are arranged to optimize storage and then allow gravity flow into the equipment in the sugar house:
There is a big vat in the shed, around 4 ft wide x 12 ft long, where the sap is boiled by a wood fire kept going in a lower chamber.
The men have been cutting and splitting wood for months, to get ready for the sugaring season. Running this operation takes two or three people. Typically, there is one man keeping his eye fixed on the temperature and other properties of the sap that is being boiled, to make sure that the syrup is drawn off at the right consistency and is not overcooked. The syrup should be drawn off when the temperature reaches 219 degrees F (104 C). Another man keeps a timer set, and every six minutes he opens the door to the fire box and throws in half a dozen pieces of wood to keep the fire burning hot:
There is also filtering and handling of the drawn-off syrup, and checking the tankage outside. As a (retired) chemical engineer, I appreciated an improvement that was added to the boiling operation. Originally, all the steam from the boiling just went into the air of the shed, making it clammy and causing condensation from the roof to drip down onto workers’ heads. The heat of this steam was basically wasted. But they added a fairly high-tech “Steamaway” heat exchanger that sits on top of most of the boiling vat. The steam rises up through channels of incoming sap from the outside. The cool sap is warmed by the rising steam to around 194 F before entering the boiling vat. This preheating means less firewood is needed to make the syrup. Also, much of the steam is condensed into hot water which can be used for washing operations. A bonus is that much less steam ends up in the atmosphere of the shed, so no more dripping onto heads.
The owner, David Franklin, and his family had the vision for this operation. They built the large shed that houses the operation themselves, and invested in the expensive equipment. David is an old-school farmer, of the type skilled in every aspect of workmanship so they can do their own welding and building and equipment repair instead of paying others to do it. Keeping a large farm running smoothly is a complex task that takes more energy and practical know-how than most suburbanites or city dwellers can imagine. The other men running the sugaring operation are all smart and efficient and hard-working, and all retired from responsible, skilled professions. It seems they do the sugaring largely out of the enjoyment of doing a job well alongside worthy companions.
However, they are all over sixty years old. They can’t keep it up indefinitely since there is a lot of physical labor involved, yet the operation can’t afford to hire young people who would do the work just for money.
It is not clear to me, therefore, what the future of operations like this will be in 15 years, as this current generation of workers ages out. Unlike a lot of production, maple syrup making cannot be simply outsourced to Asia.
Anyway, David Franklin’s syrup is delicious. You can buy some on-line here. Or if you swing by the Franklin Family Farm in Guilford, you can also get some farm fresh eggs and certified organic hamburger, and stew meat.
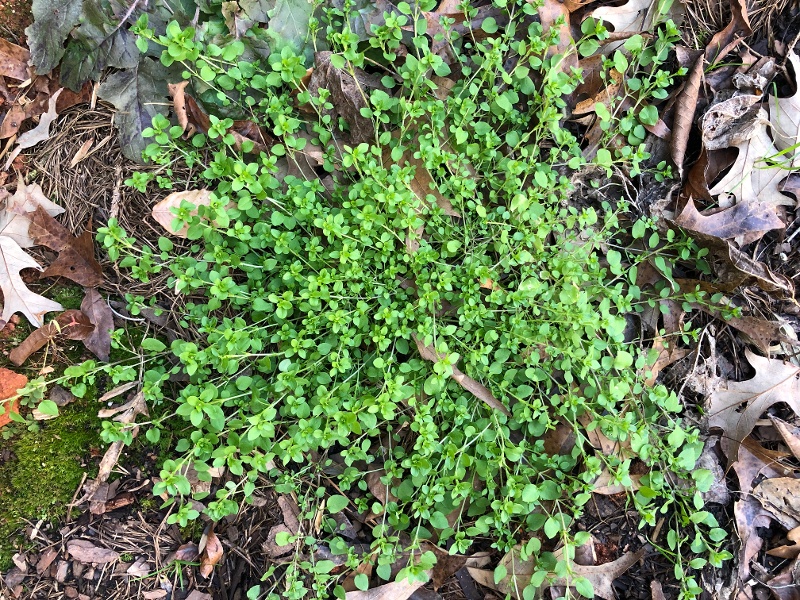
A number of weeds growing around your house are edible. Chickweed (Stellaria media) is found in lawns and random areas in cooler climates. It pops out ahead of most other plants in the spring, though it also grows year-round.
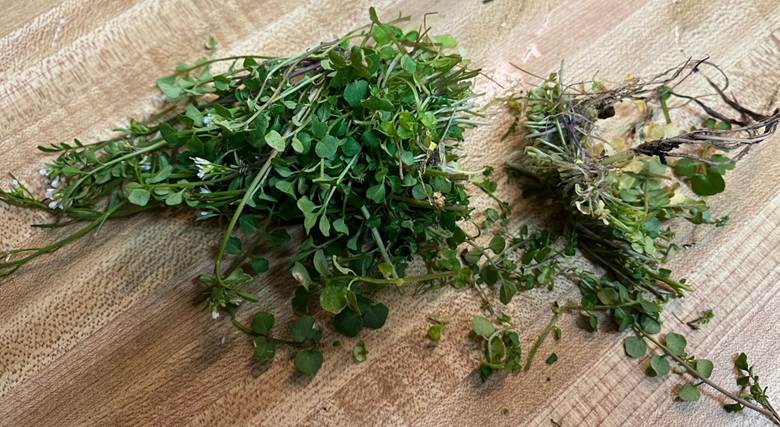
It can grow low, hiding in the grass, but it is easier to harvest as a taller standalone clump. Here is a clump from my yard, with the roots and tougher lower parts cut off:
People eat it raw, but I prefer to blanch it first to reduce any bitterness and to get rid of any critters or contaminants. To do that, I got two cups of water boiling in a Pyrex measuring cup, then dropped the chickweed in and stirred it around for a minute, followed by a cool water quench in a colander. The chickweed was then in a wilted state, but still green and crunchy and (as I understand) retaining nearly all its nutrients.
For me, chickweed functions like arugula or cilantro or Italian parsley, as an interesting and worthwhile addition to a salad or sandwich. I would not relish a whole plate of it.
Speaking of nutrients, in folk medicine chickweed is credited with amazing powers. Eat The Planet tells us that:
Chickweed is full of vitamins A, B1, B2, and C as well as fiber and protein. Due to its nutritional contents and numerous medicinal properties, this cold-weather herb has been used in folk medicine for hundreds of years. It can treat many different conditions, such as constipation, bowel problems, iron-deficiency anemia, asthma, bronchitis, joint pains, and blood disorders. It can also aid weight loss by making you feel fuller for longer.
You can also apply the herb directly onto the skin to treat itchiness, bruises, boils, ulcers, and psoriasis. To do this, you can either bruise the leaves or steep the stems in hot water before applying them directly onto the affected areas.
There is no indication that any of the plant’s constituents possess therapeutic activity. Its vitamin content is too low to be of therapeutic value.
Verywellhealth stakes out a middle ground, noting that chickweed has demonstrated significant anti-inflammatory and anti-viral activity in lab experiments with animals, but also noting that these results may or may not translate to efficacy in humans:
Juice or extracts made from chickweed have been studied in test tubes or mice models for the following conditions:
Hepatitis B. Chickweed was shown to have anti-hepatitis B virus activity in a test tube study.
Obesity. Chickweed extract given to overweight mice decreased the amount of food they consumed and their absorption of fats.
Diabetes. Chickweed leaf extract demonstrated antidiabetic effects, such as lowering blood sugar and hemoglobin A1c in mouse models.
Heart problems in people with diabetes. Chickweed tea given to diabetic rats did not improve their blood sugar levels but did seem to protect against cardiomyopathy.
Anxiety. Chickweed given to mice showed similar activity as diazepam, a classic anxiety medication in the benzodiazepine family.
For what it’s worth, I will pass along a couple of points from an optimistic take on the current stock market pullback, by Seeking Alpha author Dividend Sensei. The article is “History Says Shut Up And Buy: 12 Hyper-Growth Blue Chips To Buy Right Now”. His thesis is that corrections come and go as specific fears come and go, but tech stocks only keep going up, so now is a good time to buy.
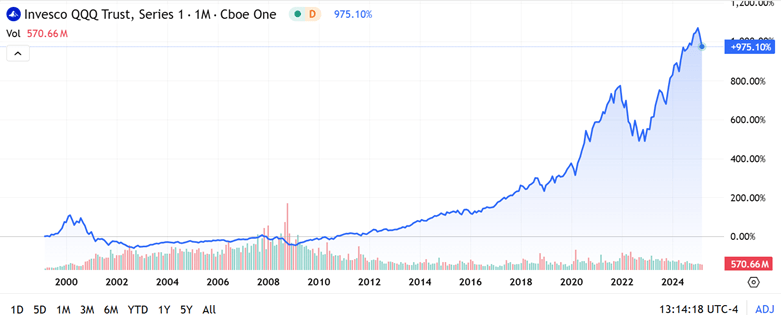
History seems to be on his side. Below is a 25-year plot of the NASDAQ 100 fund QQQ. It is true that on a really long scale, any significant dip would have been a good buying opportunity. And the run-up since 2016 has been astonishing. $10,000 invested then would be about $50,000 now. I find it sobering, however, that (just going by eyeball) it took about fourteen years for QQQ to regain its 2000 peak. That might be longer than most investors want to wait. And in the shorter term, these tech stocks lost some 80% of their market value between 2000 and 2002, and revisited that low in 2008. We can look back now from decades later and call this a “dip”, but at the time it felt like an endless investment nightmare.
(I should add that the 2000 peak pricing was not supported by appreciable cash earnings, but by breathless hype about this new thing called the “internet” that was going to change EVERYTHING. This past year has seen similar hyperventilation over AI, but in contrast to 2000, now the big tech firms make ginormous gobs of money, and gobs more each year. So maybe it really is different this time…)
QQQ total return since March 1, 1999; % scale. From Seeking Alpha.
The Psychology of Market Corrections
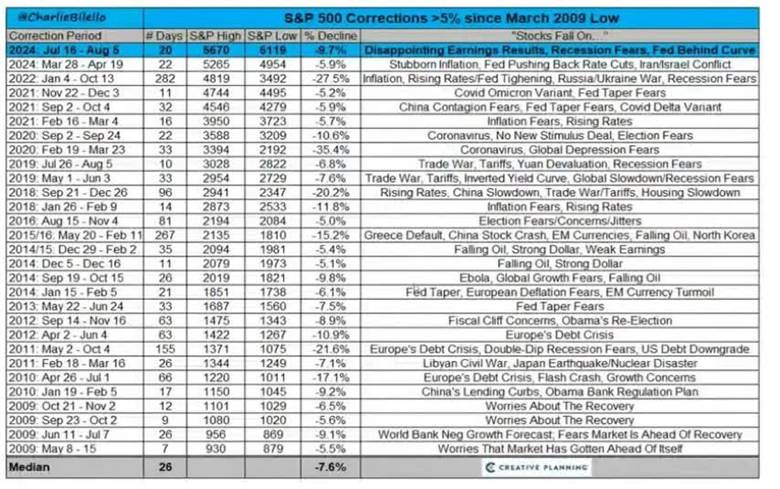
The author pointed out that every correction is based on some deep fear, and eventually that fear dissipates. I thought this table he showed of the fear factors involved in the 30 or so stock market pullbacks since the March 2009 low was interesting and instructive:
The type here may be hard to read, so I will repeat here the two most recent “fears” listed, both from 2024:
March 28-Apr 19 (5.9% drop): “Stubborn Inflation, Fed Pushing Back Rate Cuts, Iran/Israel Conflict”
These are recent enough that any market-engaged reader here will resonate with these concerns which loomed so large at the time. And yet, the collective market shrugged them all off to post a robust 21% gain for all of 2024.
Where do we go from here? I have no idea. As of writing this Tuesday morning, we seem to be bumping along at a level 2-3% higher in QQQ than the lows last week, but still 10-11 % lower than a month ago. This has brought it to levels of about late September, 2024. If I look at a five-year log plot and draw an eyeball-fit straight line through it all, it seems like prices went above that line for Nov-early Feb, in a burst of post-election enthusiasm, but have now come back to the trendline. Barring some macro or geopolitical disaster, therefore, one might expect QQQ to trend 10-15 % higher in the next twelve months (with a standard deviation of another 10% or so around the trendline). But as old-time Yankees catcher Yogi Berra said, “It’s tough to make predictions, especially about the future.”
Disclaimer: Nothing here should be considered advice to buy or sell any security.
As of the market open today, tech stocks (e.g. the NASDAQ 100 fund QQQ) are down more than 10% from their recent highs. The broader S&P 500 fund SPY is down about 8%. Hands are wringing…what does it all mean?
By applying standard definitions, we can know exactly what it means:
A pullback is a market drop of 5-10% and is very short term. It is a dip from a recent high during an ongoing bull market while upward momentum is still intact, and is a normal adjustment to a market cycle.
The market is in “correction phase” after a drop between 10-20% and can last a few months. These moves are typically met with higher volatility. Corrections can be violent as investors’ fear levels rise and panic selling may hit the market.
Real time news and social media can intensify this fear as investors may follow the herd mentality. The average market correction lasts anywhere between two and four months and is frequently accompanied by adverse market conditions. However, corrections are often seen as ideal times to buy high-value stocks at discounted prices.
So, technically, the S&P has experienced a “pullback”, while the NASDAQ 100 has undergone a “correction”. Just to round out the infernal trinity of market moves with a definition of a “bear market”:
A bear market occurs after a drop of 20+% over at least a two-month time frame. In a bear market, investor confidence has been shattered and many investors will sell their stocks for fear of further losses. Trading activity tends to decrease as do dividend yields.
Bear markets tend to become vicious cycles when rallies are sold and not bought This happened in 2000 and 2007 and can typically be seen on charts as the market makes lower lows and lower highs. Bear markets tend to occur in the contraction phase of the business cycle and last, on average, approximately 16 months.
You don’t know if you are really in a bear market until things get really bad, at which point it is probably too late to sell. (Amateurs get discouraged and sell AFTER stocks have dropped, which is why the average investor does appreciably worse than the accounts of dead people where stocks just sit there without being traded). When stocks recover at least 20% following a bear market over at least a two-month period, that is defined as the start of a new bull market regime.
Having a correction (i.e. 10-20% dip) in the middle of a bull market year is pretty normal. Although whole-year market returns have been positive for 34 out of the past 45 years, the typical year experiences a correction averaging 14%.
None of this vocabulary clarification answers the practical question of how bad will the current pullback/correction get? As usual, I read argument on both sides. The bears are saying (a) what they have been saying since 2018 or so, that the market is unrealistically overvalued, and (b) the macroeconomic world is about to fall apart, which they have also been saying for years. This time may be different, with the new administration’s erratic policies, but history shows that so far, the market is not much correlated to who is in the West Wing.
The bulls are saying (a) the market values did get run up unrealistically after the election and with AI hype, so the current pullback is just a healthy reset to a level for resuming further market growth, and (b) despite negative talking, the actual numbers show decent employment and GDP, so macro is OK (and it is very rare to have an actual bear market absent a serious bad macroeconomic driver).
If I really knew the answer here, I would be writing this from my private Caribbean island. But I’ll share how I am playing it. For the past 15 years or so, it has nearly always worked well to buy in after a say 10% correction. What seemed so gut-wrenching and scary at the time almost always turns into just a blip on the endlessly rising market charts in hindsight.
I had set aside some “dry powder” funds specifically to take advantage of buying opportunities like now. So, I am manfully mastering my fears and buying small amounts every couple days of 2X levered funds like SSO and QLD. (See here for discussion of such funds, they go up or down $2 for every $1 the underlying S&P or NASDAQ go up or down, so it’s kind of like being able to buy twice as much stock for the same dollar amount. But as usual, caveat emptor).
But I am not going all-in on any particular day. It is always frustrating to miss buying right at the bottom, but nobody rings a bell there, either. I have searing memories of March 2020 and of 2008 when just when you thought the bottom was in, it dropped out the next day or week.
Disclaimer: Nothing here should be considered advice to buy or sell any security.
Since I have posted on the recreational drugs/painkillers kava and kratom for the past two weeks (here and here), I figured I would round it out with a look at the various active compounds that can be derived from the cannabis plant. I knew of THC (the main psychoactive ingredient in weed) and CBD (very tame), but there are many others. When I visited that head shop/kava bar in Florida last month, I noted that they sold a lot of products containing THC-A, THC-P, and HHC, since THC sale is illegal there:
“Super Looper” Vapes, Containing Cannabinoids
The stork clerk showed me the following road-map (with its color-coded “Measure Your Mellow” legend) of various cannabinoids, taking you from innocuous CBD (“Non-psychoactive, soothes anxiety, anti-inflammatory; calming, relaxing”) to THC-P (“Very psychoactive, best entourage effect; energizing, euphoric, total head and body high”) and HHC-P (“Strongest and longest-lasting psychoactive effect; energizing, sativa-like effect”):
Road-Map of Cannabinoids, with putative effects.
On this roadmap, the main “THC” ingredient in weed is shown as Delta-9 or trans-delta-9-Tetrahydrocannabinol (rated as “Very Psychoactive”).
I don’t want to go too far down this rabbit-hole, but out of curiosity I looked up a few articles to try to understand this zoo of mind-altering compounds. Out of sheer laziness, I’ll start with Wikipedia’s take on the pharmacology, focusing on THC itself:
When THC enters the blood stream and reaches the brain, it binds to cannabinoid receptors. The endogenous ligand of these receptors is anandamide, the effects of which THC emulates. This agonism of the cannabinoid receptors results in changes in the levels of various neurotransmitters, especially dopamine and norepinephrine, which are closely associated with the acute effects of cannabis ingestion, such as euphoria and anxiety. Some effects may include a general altered state of consciousness, euphoria, relaxation or stress reduction, increased appreciation of the arts, including humor and music, joviality, metacognition and introspection, enhanced recollection (episodic memory), and increased sensuality, sensory awareness, libido, and creativity. Abstract or philosophical thinking, disruption of linear memory and paranoia or anxiety are also typical. Anxiety is cannabis’s most commonly reported adverse side effect. Up to 30 percent of recreational users experience intense anxiety and/or panic attacks after smoking cannabis….Cannabidiol (CBD), another cannabinoid found in cannabis, has been shown to mitigate THC’s adverse effects, including anxiety.
Cannabis produces many other subjective effects, including increased enjoyment of food taste and aroma, and marked distortions in the perception of time. At higher doses, effects can include altered body image, auditory or visual illusions, pseudohallucinations, and ataxia from selective impairment of polysynaptic reflexes. In some cases, cannabis can lead to acute psychosis and dissociative states such as depersonalization and derealization.
Regarding some other cannabinoids:
There are similar compounds in cannabis that do not exhibit psychoactive response but are obligatory for functionality: cannabidiol (CBD), an isomer of THC; cannabivarin (CBV), an analog of cannabinol (CBN) with a different side chain, cannabidivarin (CBDV), an analog of CBD with a different side chain, and cannabinolic acid. CBD is believed to regulate the metabolism of THC by inactivating cytochrome P450 enzymes that metabolize drugs; one such mechanism is via generation of carbon monoxide (a pharmacologically active neurotransmitter) by upon metabolism of CBD.[14] THC is converted rapidly to 11-hydroxy-THC, which is also pharmacologically active, so the euphoria outlasts measurable THC levels in blood.
Almost none of these psychoactive compounds are present in the raw cannabis plant. The raw plant contains THC-A, which is then converted to THC and CBD, etc., by heating (e.g. by the heat of burning the dried leaves in a joint, or by baking in brownies). THC-A itself seems to have some attractive anti-inflammatory properties. This NIH article has a listing of the major classes of cannabinoids along with a description of their chemistries. Various synthetic cannabinoids have also been created, with some them now included in pharmaceutical preparations. I have not dug into all the research, but it seems likely to me that some combination of these other cannabinoids might have more favorable effects than plain old THC.
Although CBD is not itself psychoactive, it appears to helpfully modulate the effects of THC, and to have its own useful properties. It is used to treat seizures, and possibly anxiety and chronic pain. It can be eaten (think: gummy bears) or applied in skin patches (for longest-lasting, controlled exposure) or oils or lotions. Some varieties (e.g. “Full-Spectrum”) of CBD contain traces of THC, and so act more strongly.
Taking cannabinoids via a tincture under the tongue (where it can cross a mucous membrane, into the bloodstream) takes longer than smoking to show effects, but they last longer. It also gives a more precise dosage, and avoids smoke inhalation, so this seems like a preferable route if it is available. I recall reading some months back that a mixture of THC and CBD taken sublingually was effective in controlling pain. Eating cannabis, as in “Colorado” brownies, can be problematic: it often takes several hours to take effect (via liver metabolism), so users get impatient and start eating more brownies, and then end up way higher than intended.
Long-term adverse effects of cannabis are controversial. Some researchers claim there are none, but:
There is evidence that long-term use of cannabis increases the risk of psychosis, regardless of confounding factors, and particularly for people who have genetic risk factors. A 2019 meta-analysis found that 34% of people with cannabis-induced psychosis transitioned to schizophrenia. This was found to be comparatively higher than hallucinogens (26%) and amphetamines (22%).
Long-term cannabis users are at risk for developing cannabinoid hyperemesis syndrome (CHS), characterized by recurrent bouts of intense vomiting and abdominal cramping during or within 48 hours of heavy cannabis use.
Also, a very recent large study found that 63% of long-term heavy cannabis users had significantly reduced brain function for working memory tasks. (I’ll add that I know someone whose trajectory very strongly suggests that exposure to weed in early teens put a permanent crimp in her mental and emotional functioning).
It seems that habitual use of cannabis can result in general “chill” lassitude, which lowers productivity. As one counselor told a friend of mine, “It is true that with weed ‘nothing happens.’ That is just the problem.”
Weed has long been touted as an alternative pain-killer. I know of people who claim benefits here. Most states allow “medical marijuana” for conditions such as chronic pain or nausea. However, its use is still unlawful at the federal level, so weed must be grown in-state and not transported across state lines.
This NIH site summarizes many studies on cannabis for pain. The evidence is very mixed. Often a significant fraction of subjects report improvements, but so do those on placebos.
My totally amateur takeaway from this flyover: THC and related cannabinoids have a variety of effects on the mind, mostly pleasant but sometimes bad or very bad. There seems little evidence for adverse effects of weed on the body (outside of the brain), but real dangers of messing up your brain with heavy or extended use. As usual with these recreational drugs, harmful interactions are very likely if other substances are used at the same time.
As for pain treatment, it’s effectiveness seems to vary a lot among individuals. Weed may be worth a try as an alternative to opioids, but it still carries significant dangers
If I had to pick a poison for myself as alternative painkiller, at this point it would be a tie between weed (which messes with your brain, not so much your body), and kava (whose side effects mainly show in body parts like the liver and the skin, plus brief nausea). I would experiment to see what worked for me. But first I would make every effort to treat pain through some other means. There are many possible treatments for pain which may be safer than cannabis, and new treatments keep coming. For instance, a friend with neuropathy told me that he experienced relief with a new medicine called Neuropaway.
Huge Disclaimer: I have no expert knowledge here. Don’t act on anything here. All I have done is summarize a few articles. Consult your doctor before doing anything.
P.S.
I could not resist taking a look at the side-effects of drinking alcohol. After all, we all do it, and we have all seen headlines claiming health benefits of drinking a glass of red wine a day. Well, the medical community is pretty down on drinking, saying the proven harms far outweigh the few, slight proven benefits. Even “moderate” consumption can overtax the liver, which really damages it, per this.
This article was updated on March 1 with additional information on kava side effects.
This is a follow-up to my post last week, describing my visit to a shop purveying beverages laced with kava and with kratom, two substances I had not heard of previously. As a service to readers who may deal with someone who is using these materials, here is what I have found out about what they do to people.
Upfront disclaimer: I have no expertise in this area, these are just the observations of an amateur who has read a few articles. Do not make any decisions based on this article.
Primary Effects of Kava
Kava is made from the roots of a plant in the pepper family, which is native to the Pacific Islands. There are two main classes of kava plants. The “noble” cultivars are what has traditionally been used for human consumption, via water extraction of the roots to make a beverage. The non-noble (two-day or “tudei”) cultivars grow faster (so they are cheaper for production), but are more likely to have adverse side effects. Also, the above-ground parts of the plants are known to contain toxic alkaloids.
The Wikipedia summary of effects is, “Systematic reviews and meta-analyses conducted in the last decade have typically indicated a modest positive effect of kava on anxiety and generalized anxiety disorder, though the evidence is mixed and further research is frequently recommended.”
I found a 2020 memo by a FDA toxicologist, titled “Review of the published literature pertaining to the safety of Kava for use in conventional foods”, which covers both the positive effects and the extensive side-effects. The memo notes: “The major physiological action in humans is consistently reported as a pleasant, mild, centrally acting relaxant property which induces a generalized muscle relaxation and, ultimately, a deep natural sleep. A minor property of kava is its local anesthetic properties which are experienced as numbing of the mucous membranes of the mouth and tongue when the beverage is consumed.” That all sounds pretty nice.
The main active compounds in cava are called kavalactones. Known effects of the six major kavalactones are:
For the biochemists among us: “The psychotropic effects of kava are achieved by the modulation of gamma‐amino‐butyric acid (GABA) receptors. Although the exact mechanisms are not known, studies suggest that the effects are mediated via different mechanisms such as upregulation of GABA‐A receptor function, blockade of voltage‐gated sodium ion channels, enhanced ligand binding across GABA‐A receptor subtypes, and reduced excitatory neurotransmitter release.” GABA is the primary inhibitory neurotransmitter in the central nervous system, so it is commonly targeted by tranquilizers such as benzodiazepines (e.g. Valium). Hence, the calming effect. Research suggests that kava components also inhibit the re-uptake of norepinephrine (a chemical that makes you feel alert) and of dopamine (a feel-good hormone).
Side Effects of Kava
The most controversial issue is liver damage. There were a number of very severe cases (complete liver failure) in the late 1990s/early 2000s in Europe, which led to a ban of kava in a number of countries there starting around 2002. It was not banned in the U.S., but the FDA issued an advisory letter expressing concern about liver damage.
Kava advocates were unconvinced, and further research seems to indicate that nearly all of those liver damage cases were due to use of the non-noble cultivars and/or the use of stems instead of just the roots and/or the extraction being done with some alcoholic solvent rather than water (probably due to greedy/ignorant kava suppliers). Most European countries have relaxed their outright bans, although in many cases kava sales are still restricted or regulated. Because their main market got shut off due to the liver problems, Pacific island nations scrambled to rebuild kava credibility. They now try to ensure that only proper kava is exported to the West.
Kava advocates claim that if kava is extracted the traditional way from traditional cultivars, there are no appreciable severe bad side-effects. On the other hand, the 2020 FDA memo document claimed there was a wide range of serious adverse effects of kava use among traditional kava users in the eastern Pacific, especially liver damage, among heavy kava drinkers: “Several studies show a clear association of increased level of liver enzymes GGT, ALP, and moderate to heavy kava beverage consumption as shown in Table 2…..Hepatic injury due to traditional aqueous extracts of kava root was reported in a study of 27 heavy kava drinkers in New Caledonia (Russmann et al. 2003).”
On closer examination, however, it seems that the FDA document gave an overly negative view of kava liver effects. The Russman 2003 study did not actually show “heptatic injury” among the 27 heavy kava drinkers. All it showed was elevated levels of the liver-related enzymes. It is true that there were pretty consistent observations of elevated levels of enzymes such as GGT (gamma-glutamyl transpeptidase) and ALP (alanine aminotransferase) in blood samples. Most of the studies of Polynesian subjects cited in the FDA memo lacked controls, but Brown (2007) included kava users and nonusers in its survey of Tongans living in Hawaii. This study showed high levels of GGT and ALP among the kava users, yet without any clinical indications of liver malfunction. Also, other liver-related markers in the blood such as AST, ALT, bilirubin, and ferritin were normal in the kava users. The significance of the partial abnormalities in enzymes is not clear. My guess is that the liver is somewhat stressed but not to the point of malfunction.
So it seems true that moderate consumption of kava prepared the traditional way (water extraction from roots of noble cultivars) shows no general tendency for observable liver damage. That said, the elevated liver-related enzymes are grounds for at least a little caution, and there have been a (very) few cases of genuine liver damage from traditionally extracted kava. Russman (2003) reported two women in New Caledonia who developed symptoms of liver distress from kava; these symptoms resolved after cessation of kava use. And Becker (2019) documented the case of an otherwise healthy woman in Brazil who experienced complete liver failure following 52 days of using an approved kava pill at approved dosage; her life was saved by a liver transplant. However, people die every year from eating peanuts, so I don’t know how much to read into these isolated cases of liver damage from kava.
A common effect of kava use is dermatitis, presenting as dry skin, rashes, and eruptions. (This strikes me as an allergic-type reaction). Other common side-effects can be nausea and headaches. These effects typically resolve quickly if kava use is discontinued. In the plus column, there is some sketchy evidence for anti-cancer activity by kava. In general, cognition is not impaired.
I read about sixty reviews on Amazon from purchasers of kava root powders, and more discussions on Reddit. Most were quite happy with the kava products, but emphasized that preparing the drink from the root takes some time and effort to squeeze and then filter; the brew tastes terrible, like dirt (you have to gulp it down, not sip it), and some temporary nausea is common. However, there were a nontrivial minority that reported very ugly experiences, and one man who with his first dose went comatose and nearly died. The general opinion is that kava beverage made fresh (by you or at a kava bar) from the ground root is better than capsules or packaged drinks made from kava extracts.
The exact effects may depend on your genome – some folks may get whacked, while others escape unscathed. And there may be systemic differences between how Caucasians and Polynesians react to kava. Apparently you must chug it down on an empty stomach to get the full effects. It is best to drink it in multiple small increments, rather than one giant glass. Some users chase each “shell” with a swish of some other beverage to clear the taste out, and/or eat a tiny snack like a few chips to calm the queasy stomach.
Side effects seem to be greatly amplified when kava is consumed with other substances, especially alcohol. That makes chemical sense, since kava acts on many of the same metabolic pathways as alcohol and antianxiety meds like benzodiazepines and barbiturates. This is significant, since in the West kava is often consumed in a social context which includes alcohol.
For further reading on kava effects: see an objective 2022 review by Soarez, and many pro-kava articles such as this on the kava promotion site kavacoalition.org. That site includes testimonials of people using kava instead of opioids for coping with chronic pain from injuries. Although its main function is to reduce anxiety, that in turn may mitigate the sensations of pain. A number of participants in a Reddit thread stated that kava has helped them overcome alcoholism.
One source estimated that there are about 200 kava bars in the U.S., with about half of them in Florida. After a court battle with the state, a kava bar opened in Virginia in 2024. The state has so far has not approved serving of kratom.
My takeaway on kava: It seems to me to be somewhat similar to cannabis or alcohol – light, occasional use can give a good feeling, especially pleasant as a shared experience with friends. For some, it might be helpful in coping with pain. Unlike alcohol, there seems to be no obvious tendency towards addiction. However, as with alcohol and cannabis, there is some possibility of serious adverse effects, especially with heavy use and if it is consumed with other substances. Therefore, it would seem wise to start slow with kava and monitor your body’s reactions.
Also, it is essential to make sure you are getting kava made the right way, as discussed above. At a kava bar, you can talk with the server. If you are taking capsules, I’d suggest contacting the manufacturer. Or you can buy plain kava root, and steep your own brew.
Effects of Kratom
I will spend less time on kratom effects, since it acts largely like an opioid. Need we say more.
Kratom is extracted from the leaves of an evergreen plant native to southeast Asia. We discussed some of the varieties of kratom earlier. Quotations here are all from the Wikipedia article; they mesh with what I have read elsewhere.
The active compounds are a mix of dozens of alkaloid compounds. The key ones seem to interact with opioid receptors in the brain. But the interactions are complex and poorly-understood. On the plus side, “These compounds display functional selectivity and do not activate the β-arrestin pathway partly responsible for the respiratory depression, constipation, and sedation associated with traditional opioids.”
For recreational use, “At low doses, kratom produces euphoric effects comparable to those of coca. At higher doses, kratom produces opioid-like effects.” Much of kratom use is for more serious issues, such as managing chronic pain or helping with opioid withdrawal.
There are many documented adverse side effects, resulting in many visits to hospitals:
Common side-effects include appetite loss, erectile dysfunction, nausea and constipation. More severe side-effects may include respiratory depression (decreased breathing), seizure, psychosis, elevated heart rate and blood pressure, trouble sleeping, and, rarely, liver toxicity. Addiction is a possible risk with regular use: when use is stopped, withdrawal symptoms may occur. A number of deaths have been attributed to the use of kratom, both by itself and mixed with other substances.
…Long-term use of high doses of kratom may lead to development of tolerance, dependence, and withdrawal symptoms, including loss of appetite, weight loss, decreased libido, insomnia, muscle spasms, muscle and bone pain, increased yawning and/or sneezing, myoclonus, watery eyes, hot flashes, fever, diarrhea, restlessness, anger, and sadness. This may lead to resumption of use. Frequent use of high doses of kratom may cause tremors, anorexia, weight loss, seizures, psychosis and other mental health conditions.
Perhaps the biggest concern with kratom is the high propensity for addiction and the need to increase dosage to obtain the desired effects:
Kratom is a botanical with a known addiction liability and, in vulnerable individuals, dependence may develop rather quickly with tolerance noted at three months and four- to ten-fold dose escalations required within the first few weeks…Kratom addiction carries a relapse risk as high as 78% to 89% at three months post-cessation.
In 2017 the FDA stated that “There is no reliable evidence to support the use of kratom as a treatment for opioid use disorder; there are currently no FDA-approved therapeutic uses of kratom… and the FDA has evidence to show that there are significant safety issues associated with its use.”
Some advice here on Reddit on how with kratom “less is more” — due to complex biochemical interactions, upping your dose or making it more frequent can actually diminish the desired effects, and start down the road of diminishing returns and then using higher and higher doses. And this Reddit where users describe their problems with kratom addiction:
i suggest you stop while you are still able to walk away relatively unscathed. addiction is a very disgusting thing that can happen to a person. you will absolutely feel worse than you ever thought you could feel, save for losing a child or something insane happening IRL.
some drugs will actually cause a physical addiction, like kratom. this means your body adjusts to it & stops doing its job in order to let the drug do it. now when you stop using, your body & mind are without their own processes & they are also without the drug. this leaves you empty, sick, wide awake but exhausted, sweaty but cold, aching pain. for alcohol, withdrawal can actually lead to seizures, extreme hallucinations & delusions, & even will just straight up kill you bc you need a drink so bad.
My takeaway on kratom: This one seems like playing with fire, due to its addictive properties. Also, street doses of kratom are sometimes spiked with horrible drugs like fentanyl. Thus, I see little case for promoting it for recreational use, given that there are safer alternatives such as weed, booze, and kava. (And in general, there are more fruitful ways to rise above anxiety than drinking or smoking something – – change your thinking patterns, or even use flashing lights to put your brain into alpha waves. )
It is possible that kratom could be useful to someone dealing with chronic pain, as an alternative to opioids with their known addition danger. I have deep sympathy for anyone in that position. I would hope that they would work with a medical professional or at least a trustworthy friend to monitor their usage (keeping it low, no matter what), since in these matters it is easy to deceive oneself as to what is really going on.
ADDENDUM
In case someone is tempted to try kratom out of curiosity, I will share the cautionary observation an acquaintance emailed me after reading the original version of this article:
You know, I met some heroin addicts who said that they always told themselves they wouldn’t do it, they had seen it destroy people. But they ended up one day just caving to curiosity. One day, they just shrugged and said “screw it, I wanna see what this is about.” And their life was ruined by the immediate addiction. It’s a very sad story.


